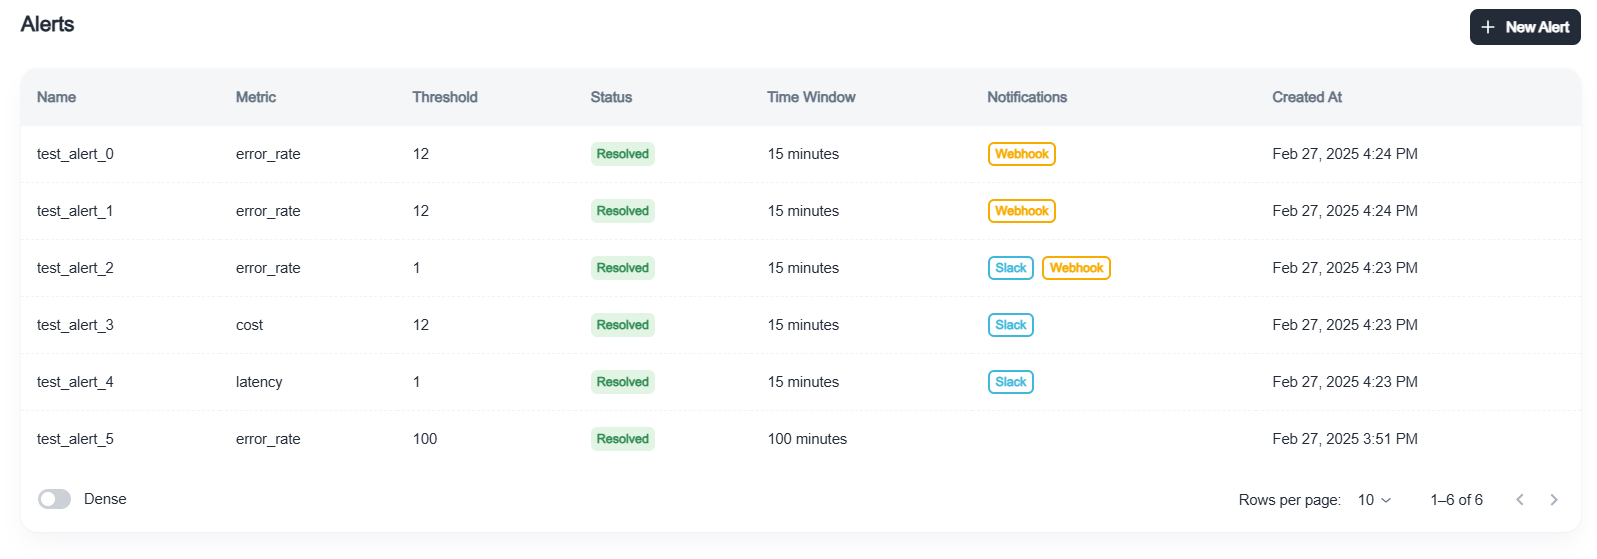
 The Alerts page lists each configured alert with its name, monitored metric, threshold, current status (triggered or resolved), and when it last fired.
## Overview
Alerts help you:
* Monitor important metrics like cost, latency, and error rates
* Set thresholds for acceptable values
* Define time windows for measurement
* Receive notifications via Slack or webhooks
* Track alert history to analyze patterns
## Available metrics
| Metric | Description |
| --------------------- | ---------------------------------------------- |
| **Cost** | Total cost of LLM calls within the time window |
| **Latency** | Response times for AI requests |
| **Error rate** | Percentage of failed requests |
| **Evaluation scores** | Quality of AI responses from scoring pipelines |
## Creating alerts
To create a new alert:
1. Navigate to your app's **Alerts** tab in the Dashboard
2. Click **Create Alert**
3. Configure the alert:
* **Name**: descriptive name for the alert
* **Metric**: what to monitor. AgentMark validates thresholds per metric: error rate 0-100 (percent), latency a positive integer in milliseconds, cost greater than 0 (dollars), evaluation score between 0 and 1
* **Threshold**: value that triggers the alert
* **Time window**: period over which AgentMark measures the metric, between 5 and 100 minutes
* **Evaluation name** (for score alerts): specific score to monitor
* **Aggregation type** (for score alerts): average or individual scores
* **Threshold direction** (for score alerts): alert above or below threshold
A new alert binds to the environment selected in the Dashboard header; alerts without an environment apply app-wide and appear under every environment.
## Notification options
### Slack integration
Receive alerts directly in Slack:
1. Connect Slack and pick the notification channel in **Settings → Integrations**. The channel binding is per environment, so each environment can post to its own channel
2. Enable the **Slack Notifications** toggle when creating an alert
If you enable the toggle before you connect Slack, the dialog shows a **Connect Slack** button that takes you to Settings → Integrations.
### Webhooks
For custom integrations:
1. Configure your webhook endpoint in **Settings → Integrations** (per environment)
2. Enable the **Custom Webhook** toggle when creating an alert
3. Receive alerts as HTTP POST requests with alert details
For webhook payload format and implementation details, see the [Webhook documentation](/deploy/webhooks).
### Alerts API
You can also create and manage alerts programmatically through `/v1/alerts` (CRUD, trigger history, and Slack channel listing). See the [API reference](/api-reference/overview).
## Alert status
Alerts have two states:
* **Triggered**: the monitored metric has crossed the threshold.
* **Resolved**: the metric has returned to the acceptable side of the threshold.
## Alert history
View alert history to analyze patterns:
1. Navigate to the **Alerts** tab
2. Click an alert to see when it triggered, the value that triggered it, when it resolved, and how frequently it fires
## Use cases
* **Cost management**: get notified when daily spending exceeds budget
* **Performance monitoring**: alert when latency degrades beyond acceptable levels
* **Quality assurance**: track when evaluation scores drop below quality thresholds
* **Error detection**: catch error rate spikes before they impact users
## Best practices
* **Set thresholds from your baseline.** Start above your observed normal range, then tighten as you learn your traffic.
* **Choose appropriate windows** to match your usage patterns and avoid alert fatigue.
* **Configure multiple channels.** Use Slack plus a webhook for critical alerts.
* **Revisit thresholds** as your usage patterns evolve.
## Next steps
The Alerts page lists each configured alert with its name, monitored metric, threshold, current status (triggered or resolved), and when it last fired.
## Overview
Alerts help you:
* Monitor important metrics like cost, latency, and error rates
* Set thresholds for acceptable values
* Define time windows for measurement
* Receive notifications via Slack or webhooks
* Track alert history to analyze patterns
## Available metrics
| Metric | Description |
| --------------------- | ---------------------------------------------- |
| **Cost** | Total cost of LLM calls within the time window |
| **Latency** | Response times for AI requests |
| **Error rate** | Percentage of failed requests |
| **Evaluation scores** | Quality of AI responses from scoring pipelines |
## Creating alerts
To create a new alert:
1. Navigate to your app's **Alerts** tab in the Dashboard
2. Click **Create Alert**
3. Configure the alert:
* **Name**: descriptive name for the alert
* **Metric**: what to monitor. AgentMark validates thresholds per metric: error rate 0-100 (percent), latency a positive integer in milliseconds, cost greater than 0 (dollars), evaluation score between 0 and 1
* **Threshold**: value that triggers the alert
* **Time window**: period over which AgentMark measures the metric, between 5 and 100 minutes
* **Evaluation name** (for score alerts): specific score to monitor
* **Aggregation type** (for score alerts): average or individual scores
* **Threshold direction** (for score alerts): alert above or below threshold
A new alert binds to the environment selected in the Dashboard header; alerts without an environment apply app-wide and appear under every environment.
## Notification options
### Slack integration
Receive alerts directly in Slack:
1. Connect Slack and pick the notification channel in **Settings → Integrations**. The channel binding is per environment, so each environment can post to its own channel
2. Enable the **Slack Notifications** toggle when creating an alert
If you enable the toggle before you connect Slack, the dialog shows a **Connect Slack** button that takes you to Settings → Integrations.
### Webhooks
For custom integrations:
1. Configure your webhook endpoint in **Settings → Integrations** (per environment)
2. Enable the **Custom Webhook** toggle when creating an alert
3. Receive alerts as HTTP POST requests with alert details
For webhook payload format and implementation details, see the [Webhook documentation](/deploy/webhooks).
### Alerts API
You can also create and manage alerts programmatically through `/v1/alerts` (CRUD, trigger history, and Slack channel listing). See the [API reference](/api-reference/overview).
## Alert status
Alerts have two states:
* **Triggered**: the monitored metric has crossed the threshold.
* **Resolved**: the metric has returned to the acceptable side of the threshold.
## Alert history
View alert history to analyze patterns:
1. Navigate to the **Alerts** tab
2. Click an alert to see when it triggered, the value that triggered it, when it resolved, and how frequently it fires
## Use cases
* **Cost management**: get notified when daily spending exceeds budget
* **Performance monitoring**: alert when latency degrades beyond acceptable levels
* **Quality assurance**: track when evaluation scores drop below quality thresholds
* **Error detection**: catch error rate spikes before they impact users
## Best practices
* **Set thresholds from your baseline.** Start above your observed normal range, then tighten as you learn your traffic.
* **Choose appropriate windows** to match your usage patterns and avoid alert fatigue.
* **Configure multiple channels.** Use Slack plus a webhook for critical alerts.
* **Revisit thresholds** as your usage patterns evolve.
## Next steps
Reach out any time: