 ***
## Operational metrics
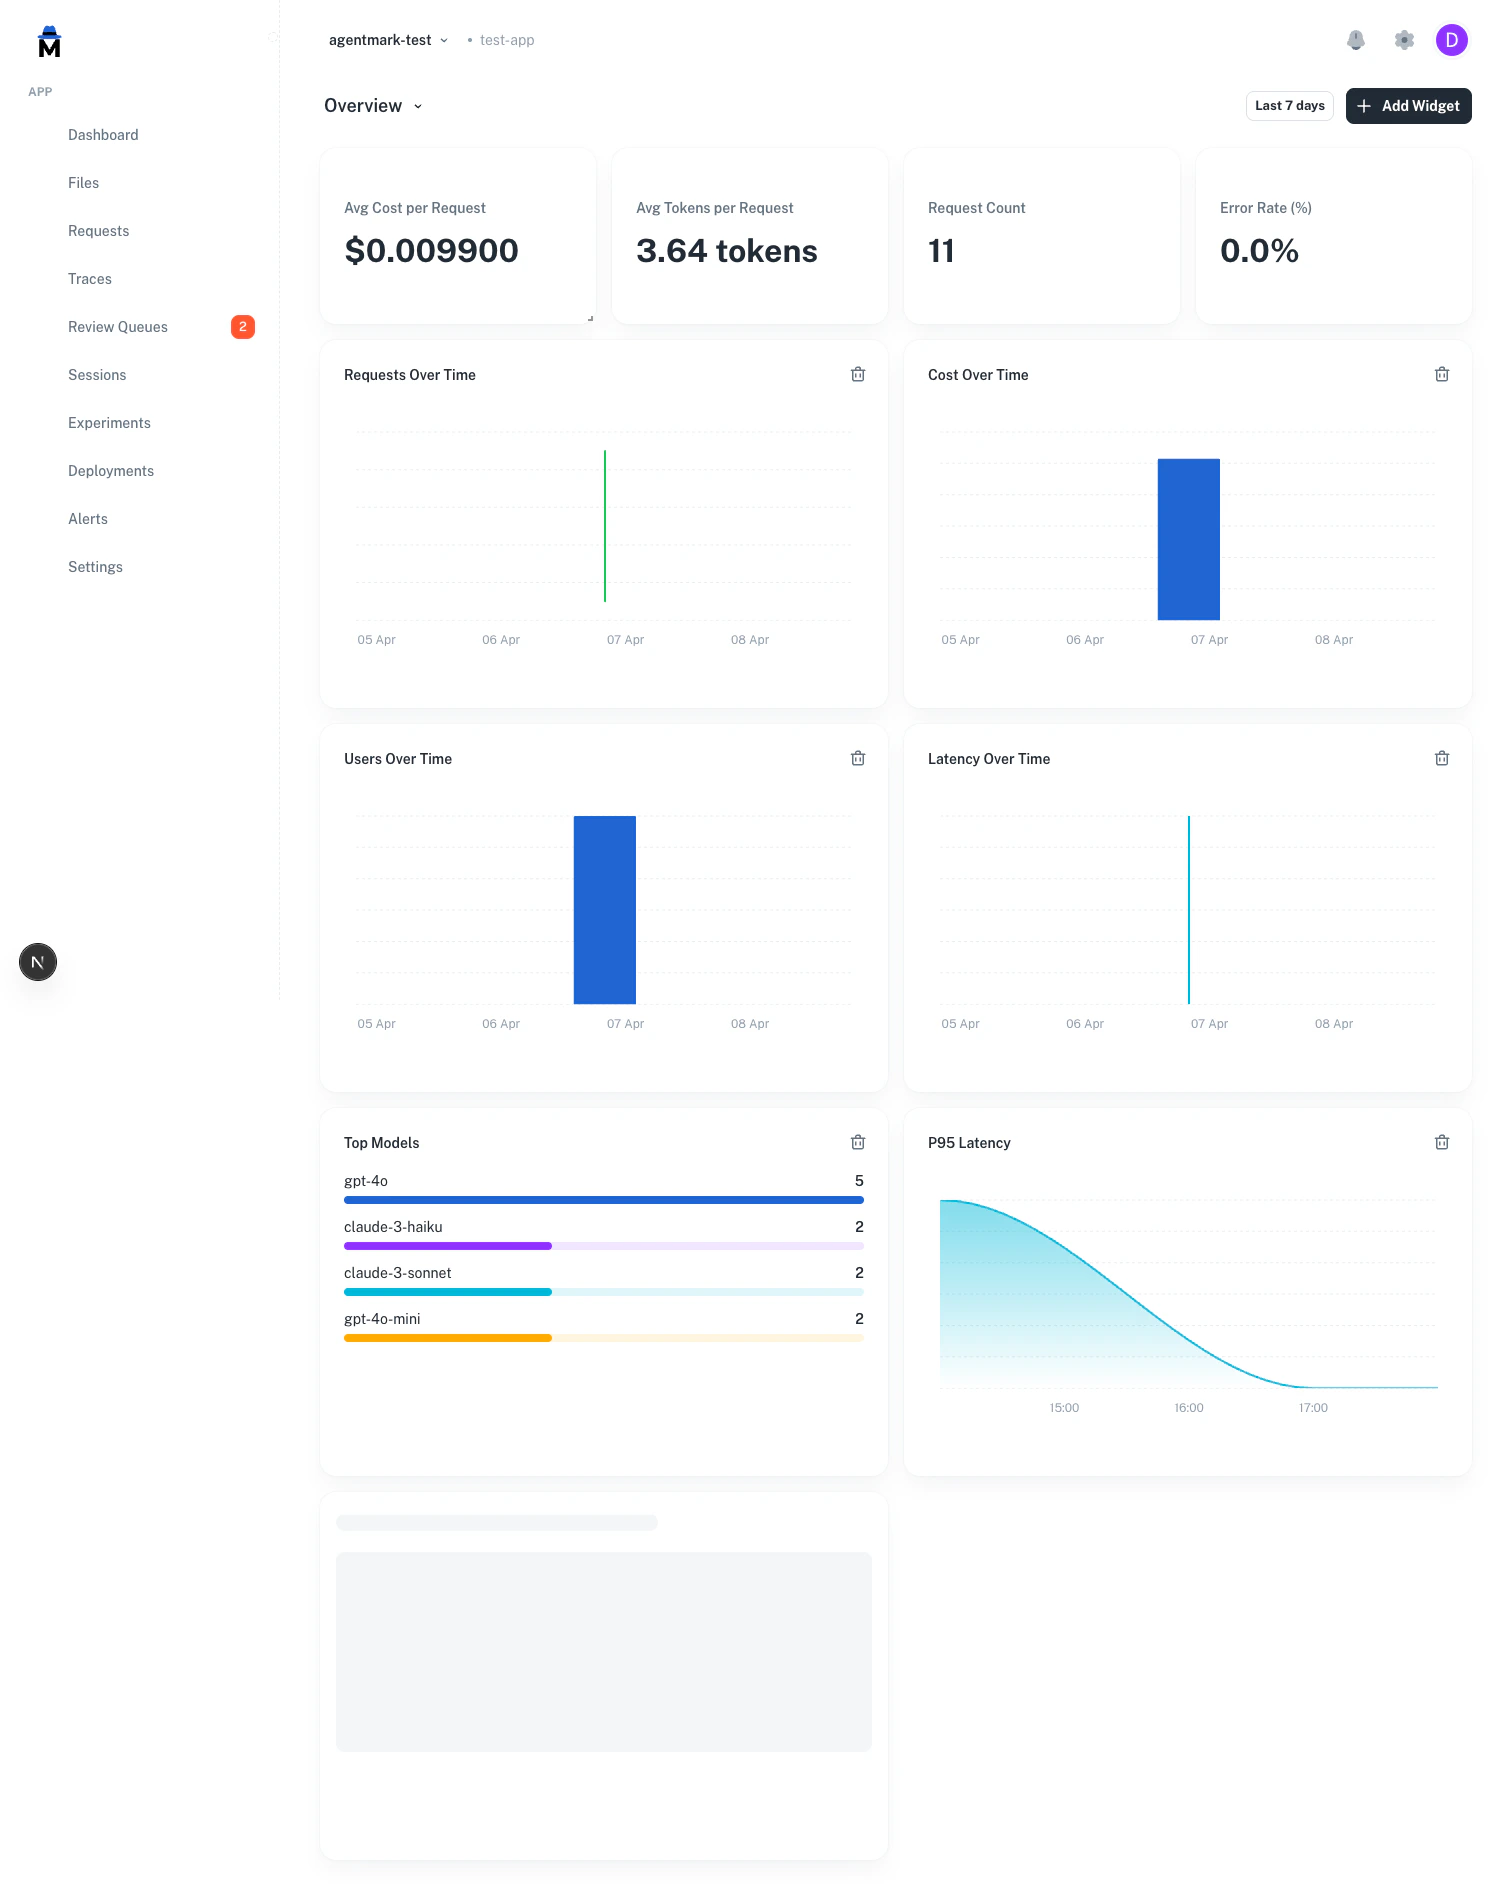
The Dashboard automatically tracks key metrics from your prompt executions:
| Category | Metrics |
| ----------- | ----------------------------------------------------------- |
| **Cost** | Total cost, average cost per request, cost by model |
| **Latency** | Average latency, P50/P95/P99 percentiles, latency trends |
| **Tokens** | Input tokens, output tokens, total tokens, tokens by model |
| **Volume** | Request count, error count, error rate, unique users |
| **Models** | Request count per model, cost per model, top models ranking |
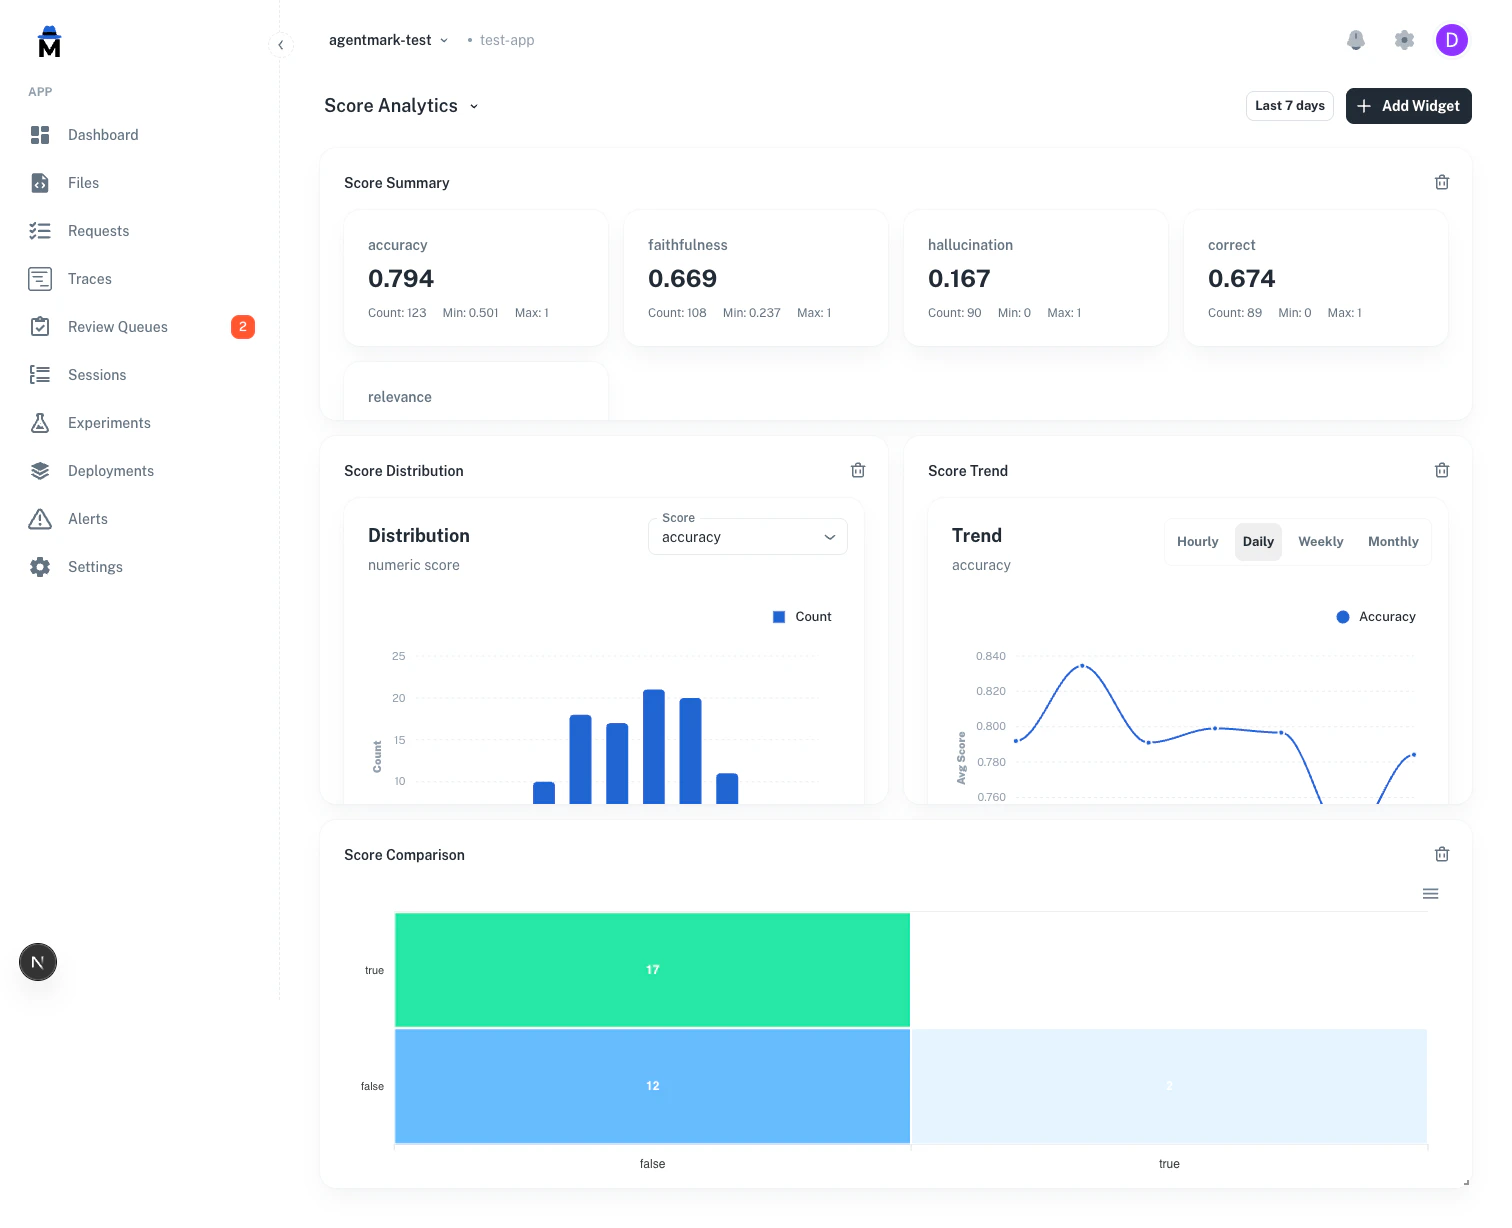
These appear as widgets on your Dashboard: stat cards for at-a-glance numbers, line/bar/area charts for trends.
***
## Score analytics
Score analytics are available as **dashboard widgets**. Add them to any dashboard through the "Add widget" dialog, or start from the **Score analytics** template in the template gallery.
Four score widget types are available:
### Summary cards
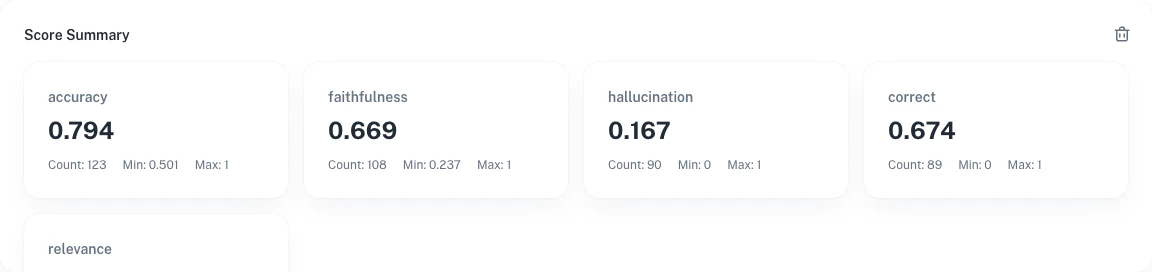
Aggregated statistics for each score name:
* **Avg**: Mean score value
* **Count**: Total number of scores recorded
* **Min / Max**: Range of observed values
***
## Operational metrics
The Dashboard automatically tracks key metrics from your prompt executions:
| Category | Metrics |
| ----------- | ----------------------------------------------------------- |
| **Cost** | Total cost, average cost per request, cost by model |
| **Latency** | Average latency, P50/P95/P99 percentiles, latency trends |
| **Tokens** | Input tokens, output tokens, total tokens, tokens by model |
| **Volume** | Request count, error count, error rate, unique users |
| **Models** | Request count per model, cost per model, top models ranking |
These appear as widgets on your Dashboard: stat cards for at-a-glance numbers, line/bar/area charts for trends.
***
## Score analytics
Score analytics are available as **dashboard widgets**. Add them to any dashboard through the "Add widget" dialog, or start from the **Score analytics** template in the template gallery.
Four score widget types are available:
### Summary cards
Aggregated statistics for each score name:
* **Avg**: Mean score value
* **Count**: Total number of scores recorded
* **Min / Max**: Range of observed values
 ### Score distribution
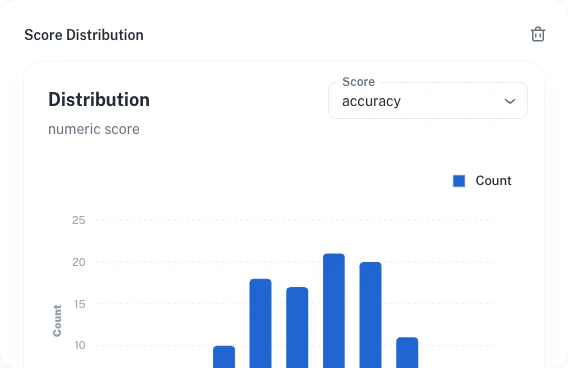
The histogram shows the distribution of score values. AgentMark auto-detects the score type:
* **Numeric scores**: 10 equal-width bins between min and max
* **Categorical scores**: Bar chart by category label
* **Boolean scores**: Two bars for true/false
### Score distribution
The histogram shows the distribution of score values. AgentMark auto-detects the score type:
* **Numeric scores**: 10 equal-width bins between min and max
* **Categorical scores**: Bar chart by category label
* **Boolean scores**: Two bars for true/false
 ### Trend over time
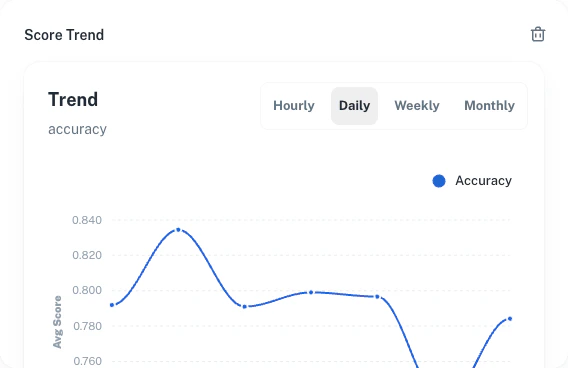
Average score values over time, bucketed by the dashboard's selected time granularity.
### Trend over time
Average score values over time, bucketed by the dashboard's selected time granularity.
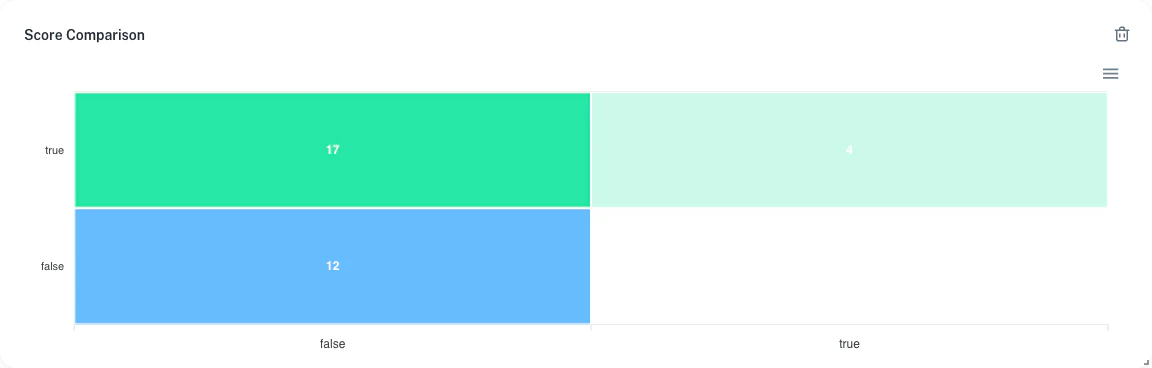
 ### Score comparison
Compare two scores of the same type to see how they align across shared traces:
* **Categorical / Boolean**: Confusion matrix (N×M heatmap)
* **Numeric**: Scatter plot with paired values
### Score comparison
Compare two scores of the same type to see how they align across shared traces:
* **Categorical / Boolean**: Confusion matrix (N×M heatmap)
* **Numeric**: Scatter plot with paired values
 ### Available metrics
**Volume:** `request_count`, `unique_users`, `total_tokens`, `avg_tokens`
**Cost:** `total_cost`, `avg_cost`
**Errors:** `error_count`, `error_rate`
**Latency:** `avg_latency`, `p50_latency`, `p95_latency`, `p99_latency`
**Rankings:** `top_models`
### Adding widgets
1. Click **+ Add widget** in the dashboard header
2. Choose a title and metric. Operational metrics are under "Built-in" and "Derived"; score metrics are under "Scores"
3. For score widgets, enter the score name(s) to track
4. Choose a visualization type and optional group-by dimension
5. The widget appears on the grid. Drag to rearrange
Operational widgets support **group-by** dimensions (model, user, metadata key), **time granularity**, and **filters** (model, user ID, status).
***
## Templates
Start from a pre-built template or create a blank dashboard.
### Available metrics
**Volume:** `request_count`, `unique_users`, `total_tokens`, `avg_tokens`
**Cost:** `total_cost`, `avg_cost`
**Errors:** `error_count`, `error_rate`
**Latency:** `avg_latency`, `p50_latency`, `p95_latency`, `p99_latency`
**Rankings:** `top_models`
### Adding widgets
1. Click **+ Add widget** in the dashboard header
2. Choose a title and metric. Operational metrics are under "Built-in" and "Derived"; score metrics are under "Scores"
3. For score widgets, enter the score name(s) to track
4. Choose a visualization type and optional group-by dimension
5. The widget appears on the grid. Drag to rearrange
Operational widgets support **group-by** dimensions (model, user, metadata key), **time granularity**, and **filters** (model, user ID, status).
***
## Templates
Start from a pre-built template or create a blank dashboard.
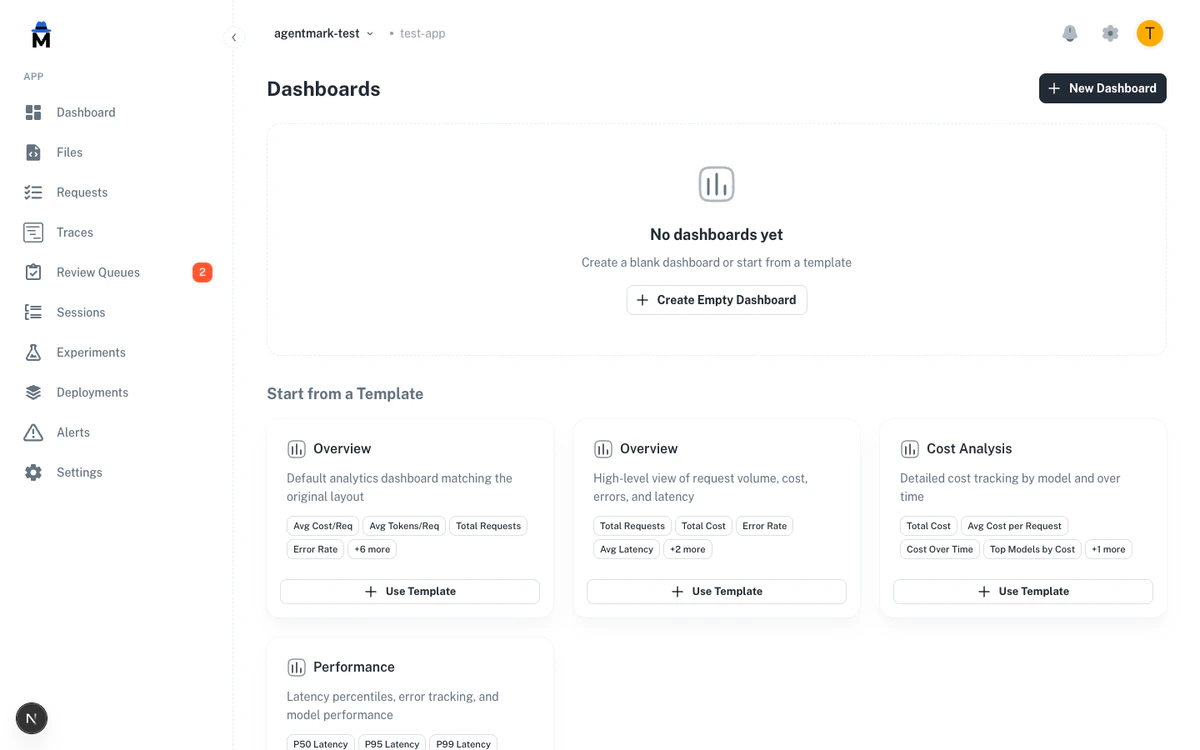 | Template | What it includes |
| ------------------- | ------------------------------------------------------------------------ |
| **Overview** | Request volume, cost, errors, latency (stat cards + time series) |
| **Cost analysis** | Total cost, avg cost/request, cost over time, top models by cost, tokens |
| **Performance** | P50/P95/P99 latency, error count, error rate |
| **Score analytics** | Score summary, distribution, trend, and comparison widgets |
***
## Dashboard settings
* **Default dashboard**: mark any dashboard as default to load it when you visit the Dashboards page
* **Time range**: a global selector that applies to all widgets on the dashboard
***
## Metrics API
You can retrieve aggregated operational metrics programmatically using the public REST API. The `GET /v1/metrics` endpoint returns a summary and an hourly time series for trace volume, latency, cost, token usage, and error rates.
```bash theme={null}
curl "https://api.agentmark.co/v1/metrics?start_date=2026-04-01T00:00:00Z&end_date=2026-04-18T00:00:00Z&extended=true" \
-H "Authorization: Bearer am_live_abc123" \
-H "X-Agentmark-App-Id: app_abc123"
```
Required parameters: `start_date` and `end_date` (ISO 8601). Pass `extended=true` for per-request averages and model count. See the [Metrics API reference](/api-reference/overview) for the full response schema.
***
## Scores API
You can create and retrieve scores programmatically using the public REST API. This is useful for recording evaluation results, human feedback, or quality metrics from automated pipelines.
**Create a score for a span or trace:**
```bash theme={null}
curl -X POST "https://api.agentmark.co/v1/scores" \
-H "Authorization: Bearer am_live_abc123" \
-H "X-Agentmark-App-Id: app_abc123" \
-H "Content-Type: application/json" \
-d '{
"resource_id": "span_abc123",
"name": "quality",
"score": 0.95,
"label": "high_quality",
"reason": "Response addresses all requirements."
}'
```
**List scores for a resource:**
```bash theme={null}
curl "https://api.agentmark.co/v1/scores?resource_id=span_abc123" \
-H "Authorization: Bearer am_live_abc123" \
-H "X-Agentmark-App-Id: app_abc123"
```
**Get a single score by ID:**
```bash theme={null}
curl "https://api.agentmark.co/v1/scores/550e8400-e29b-41d4-a716-446655440000" \
-H "Authorization: Bearer am_live_abc123" \
-H "X-Agentmark-App-Id: app_abc123"
```
**Delete a score:**
```bash theme={null}
curl -X DELETE "https://api.agentmark.co/v1/scores/550e8400-e29b-41d4-a716-446655440000" \
-H "Authorization: Bearer am_live_abc123" \
-H "X-Agentmark-App-Id: app_abc123"
```
Scores created via the API appear in the score analytics widgets on your dashboards. See the [Scoring API reference](/api-reference/overview) for the full request and response schema.
## Next steps
Set up [Alerts](/observe/alerts) to get notified when the metrics on your dashboards cross a threshold, or dig into individual requests in [Traces and logs](/observe/traces-and-logs).
| Template | What it includes |
| ------------------- | ------------------------------------------------------------------------ |
| **Overview** | Request volume, cost, errors, latency (stat cards + time series) |
| **Cost analysis** | Total cost, avg cost/request, cost over time, top models by cost, tokens |
| **Performance** | P50/P95/P99 latency, error count, error rate |
| **Score analytics** | Score summary, distribution, trend, and comparison widgets |
***
## Dashboard settings
* **Default dashboard**: mark any dashboard as default to load it when you visit the Dashboards page
* **Time range**: a global selector that applies to all widgets on the dashboard
***
## Metrics API
You can retrieve aggregated operational metrics programmatically using the public REST API. The `GET /v1/metrics` endpoint returns a summary and an hourly time series for trace volume, latency, cost, token usage, and error rates.
```bash theme={null}
curl "https://api.agentmark.co/v1/metrics?start_date=2026-04-01T00:00:00Z&end_date=2026-04-18T00:00:00Z&extended=true" \
-H "Authorization: Bearer am_live_abc123" \
-H "X-Agentmark-App-Id: app_abc123"
```
Required parameters: `start_date` and `end_date` (ISO 8601). Pass `extended=true` for per-request averages and model count. See the [Metrics API reference](/api-reference/overview) for the full response schema.
***
## Scores API
You can create and retrieve scores programmatically using the public REST API. This is useful for recording evaluation results, human feedback, or quality metrics from automated pipelines.
**Create a score for a span or trace:**
```bash theme={null}
curl -X POST "https://api.agentmark.co/v1/scores" \
-H "Authorization: Bearer am_live_abc123" \
-H "X-Agentmark-App-Id: app_abc123" \
-H "Content-Type: application/json" \
-d '{
"resource_id": "span_abc123",
"name": "quality",
"score": 0.95,
"label": "high_quality",
"reason": "Response addresses all requirements."
}'
```
**List scores for a resource:**
```bash theme={null}
curl "https://api.agentmark.co/v1/scores?resource_id=span_abc123" \
-H "Authorization: Bearer am_live_abc123" \
-H "X-Agentmark-App-Id: app_abc123"
```
**Get a single score by ID:**
```bash theme={null}
curl "https://api.agentmark.co/v1/scores/550e8400-e29b-41d4-a716-446655440000" \
-H "Authorization: Bearer am_live_abc123" \
-H "X-Agentmark-App-Id: app_abc123"
```
**Delete a score:**
```bash theme={null}
curl -X DELETE "https://api.agentmark.co/v1/scores/550e8400-e29b-41d4-a716-446655440000" \
-H "Authorization: Bearer am_live_abc123" \
-H "X-Agentmark-App-Id: app_abc123"
```
Scores created via the API appear in the score analytics widgets on your dashboards. See the [Scoring API reference](/api-reference/overview) for the full request and response schema.
## Next steps
Set up [Alerts](/observe/alerts) to get notified when the metrics on your dashboards cross a threshold, or dig into individual requests in [Traces and logs](/observe/traces-and-logs).
Reach out any time: