> ## Documentation Index
> Fetch the complete documentation index at: https://docs.agentmark.co/llms.txt
> Use this file to discover all available pages before exploring further.
# Filtering and search
> Find specific traces and sessions using filters, date ranges, sorting, saved views, and shareable URLs
**Cloud feature.** Filtering and search is available in the [AgentMark Dashboard](https://app.agentmark.co).
AgentMark provides a filtering system across both the Traces and Sessions pages. You can combine multiple filters, sort by any column, save filter configurations as views, and share filtered results via URL.
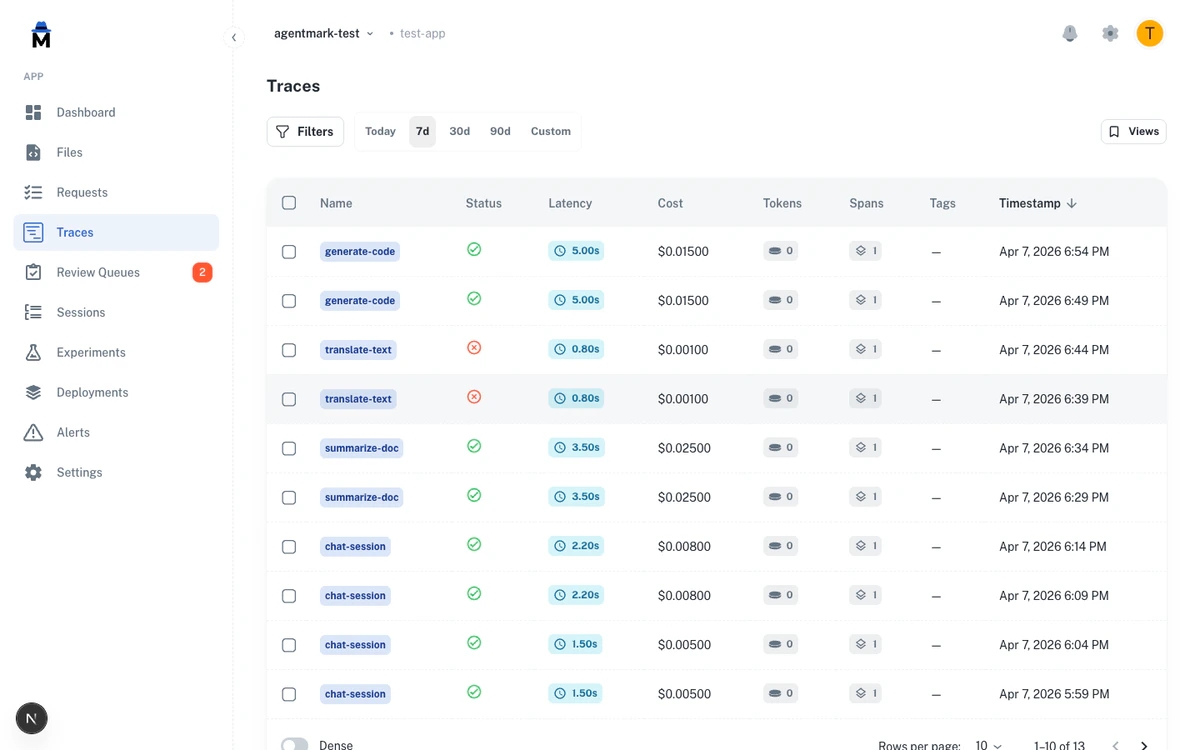 ## Filter popover
Click the **Filters** button above the trace or session list to open the filter popover. From here you can build filter expressions by adding one or more filter rows.
Each filter row consists of three parts:
1. **Field**: the trace attribute to filter on
2. **Operator**: the comparison to apply
3. **Value**: the value to match against
Click **Apply** to execute the filters, or **Clear** to reset all filter rows.
## Filter popover
Click the **Filters** button above the trace or session list to open the filter popover. From here you can build filter expressions by adding one or more filter rows.
Each filter row consists of three parts:
1. **Field**: the trace attribute to filter on
2. **Operator**: the comparison to apply
3. **Value**: the value to match against
Click **Apply** to execute the filters, or **Clear** to reset all filter rows.
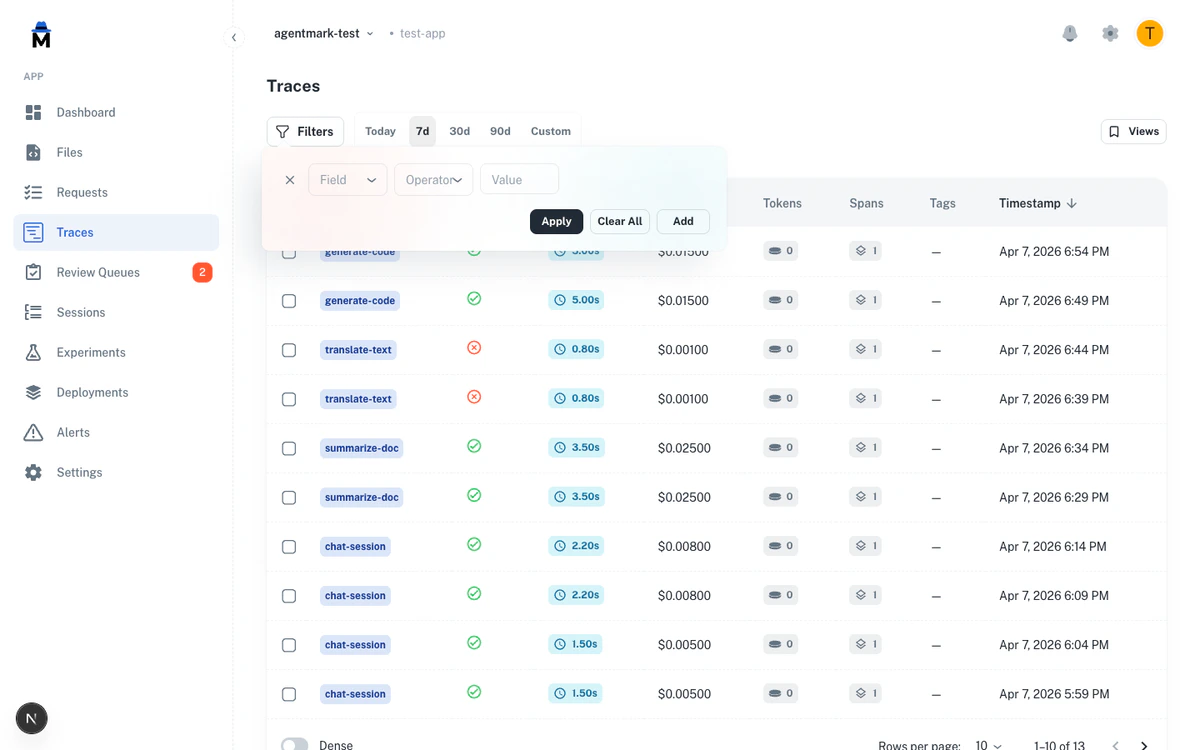 You can add multiple filter rows to narrow results further. AgentMark combines all filters with AND logic, so a trace must match every active filter to appear in the results.
## Available filter fields
### String fields
These fields support: **equals**, **not equals**, **contains**, **not contains**, **starts with**, and **ends with**.
* **Model** (`model_used`): the LLM model used for the inference (for example, `gpt-5`, `claude-sonnet-4-20250514`)
* **User ID** (`user_id`): the user identifier attached to the trace
* **Prompt** (`prompt_name`): the prompt or function name
* **Session** (`session_id`): the session identifier grouping related traces
### Enum fields
* **Status** (`status`): filter by trace outcome. Values: **OK** or **ERROR**. Supports **equals** and **not equals**.
* **Span kind** (`semantic_kind`): filter by the semantic type of span. Values: **function**, **llm**, **tool**, **agent**, **retrieval**, **embedding**, **guardrail**. Supports **equals** and **not equals**.
### Numeric fields
These fields support: **equals**, **not equals**, `<`, `<=`, `>`, and `>=`.
* **Latency (ms)** (`latency_ms`): total execution time in milliseconds
* **Cost (\$)** (`cost`): the computed cost of the inference
* **Prompt tokens** (`prompt_tokens`): number of input tokens consumed
* **Completion tokens** (`completion_tokens`): number of output tokens generated
### Content fields
These fields support **contains** and **starts with** only.
* **Input** (`input`): the prompt input text
* **Output** (`output`): the model response text
### Tags
* **Tags** (`tags`): trace-level tag labels. Supports **equals**, **not equals**, and **contains**.
### Dynamic fields
You can add multiple filter rows to narrow results further. AgentMark combines all filters with AND logic, so a trace must match every active filter to appear in the results.
## Available filter fields
### String fields
These fields support: **equals**, **not equals**, **contains**, **not contains**, **starts with**, and **ends with**.
* **Model** (`model_used`): the LLM model used for the inference (for example, `gpt-5`, `claude-sonnet-4-20250514`)
* **User ID** (`user_id`): the user identifier attached to the trace
* **Prompt** (`prompt_name`): the prompt or function name
* **Session** (`session_id`): the session identifier grouping related traces
### Enum fields
* **Status** (`status`): filter by trace outcome. Values: **OK** or **ERROR**. Supports **equals** and **not equals**.
* **Span kind** (`semantic_kind`): filter by the semantic type of span. Values: **function**, **llm**, **tool**, **agent**, **retrieval**, **embedding**, **guardrail**. Supports **equals** and **not equals**.
### Numeric fields
These fields support: **equals**, **not equals**, `<`, `<=`, `>`, and `>=`.
* **Latency (ms)** (`latency_ms`): total execution time in milliseconds
* **Cost (\$)** (`cost`): the computed cost of the inference
* **Prompt tokens** (`prompt_tokens`): number of input tokens consumed
* **Completion tokens** (`completion_tokens`): number of output tokens generated
### Content fields
These fields support **contains** and **starts with** only.
* **Input** (`input`): the prompt input text
* **Output** (`output`): the model response text
### Tags
* **Tags** (`tags`): trace-level tag labels. Supports **equals**, **not equals**, and **contains**.
### Dynamic fields
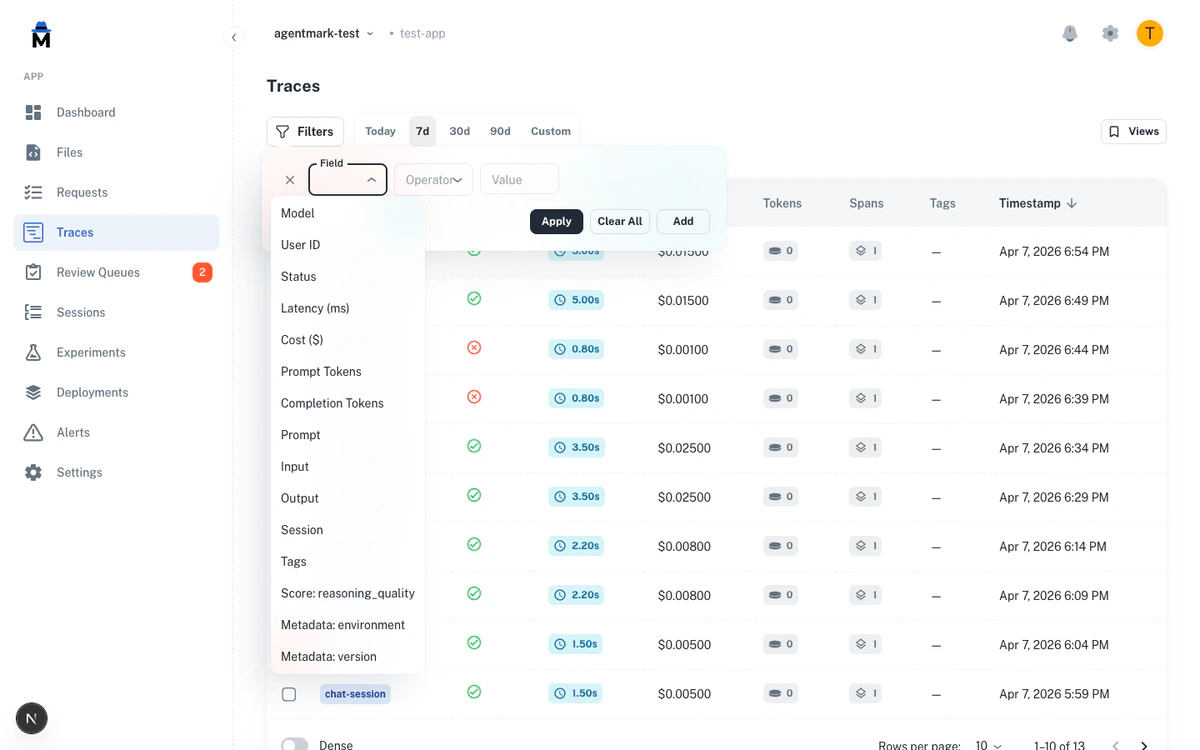 These fields are auto-populated from your application's trace data.
* **Metadata: \{key}** (`metadata.*`): any custom metadata key attached to your traces. Supports the string operators plus the existence operators (see [Metadata filtering](#metadata-filtering)).
* **Score: \{name}** (`score__*`): evaluation score names from your app's scoring pipeline. Supports the numeric operators.
## Date range
Both the Traces and Sessions pages include a date range selector. Use the preset ranges or define a custom window:
* **Today**: traces from the current day
* **7d**: last 7 days
* **30d**: last 30 days
* **90d**: last 90 days
* **Custom**: pick a specific start and end date (UTC)
The date range applies alongside any active filters.
## Column sorting
Sort any sortable column in the trace and session lists by clicking its column header. Click once to sort ascending, click again to toggle to descending. Only one sort column is active at a time.
## Active filters bar
These fields are auto-populated from your application's trace data.
* **Metadata: \{key}** (`metadata.*`): any custom metadata key attached to your traces. Supports the string operators plus the existence operators (see [Metadata filtering](#metadata-filtering)).
* **Score: \{name}** (`score__*`): evaluation score names from your app's scoring pipeline. Supports the numeric operators.
## Date range
Both the Traces and Sessions pages include a date range selector. Use the preset ranges or define a custom window:
* **Today**: traces from the current day
* **7d**: last 7 days
* **30d**: last 30 days
* **90d**: last 90 days
* **Custom**: pick a specific start and end date (UTC)
The date range applies alongside any active filters.
## Column sorting
Sort any sortable column in the trace and session lists by clicking its column header. Click once to sort ascending, click again to toggle to descending. Only one sort column is active at a time.
## Active filters bar
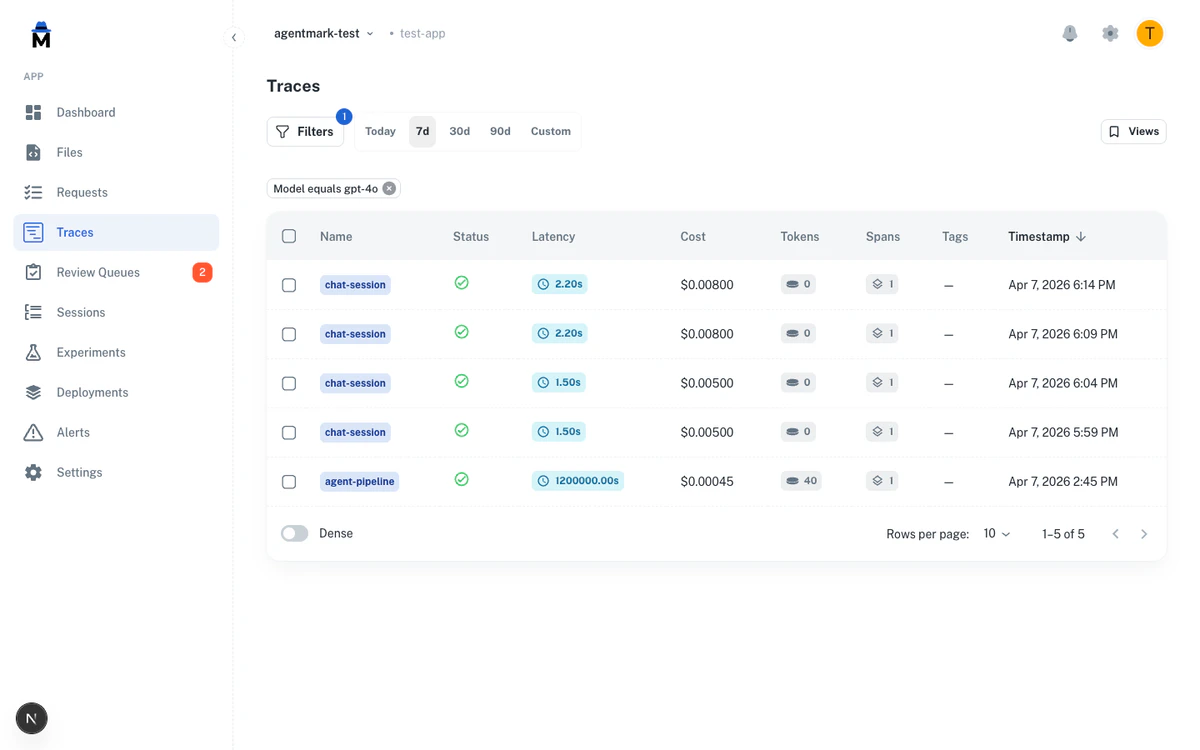 When you apply filters, they appear as removable chips above the results list. Each chip shows the field, operator, and value. Click the **X** on a chip to remove that individual filter without clearing the rest.
## Score filtering
AgentMark automatically detects evaluation score names from your trace data and makes them available as filter fields. This lets you find traces based on quality metrics from your evaluation pipeline.
To filter by score:
1. Open the filter popover
2. Select a score field (for example, **Score: accuracy**)
3. Choose a numeric operator (for example, `>=`)
4. Enter the threshold value (for example, `0.8`)
5. Click **Apply**
Score names are dynamically populated. You only see score fields that exist in your application's trace data.
## Metadata filtering
If you attach custom metadata to your traces (via `agentmark.metadata.*` attributes), those keys are automatically discovered and available as filter fields.
To filter by metadata:
1. Open the filter popover
2. Select a metadata field (for example, **Metadata: environment**)
3. Choose an operator (for example, **equals**)
4. Enter the value (for example, `production`)
5. Click **Apply**
You can also use the `exists` and `does not exist` operators to find traces that have (or lack) a specific metadata key, regardless of value.
Use metadata filters to separate environments, feature flags, A/B test variants, or any other custom dimensions you track.
## Tag filtering
Tags are string labels attached to traces via the SDK for categorization by environment, team, feature, experiment, or release. Tags appear as a column in the trace list and are filterable through the filter popover.
To filter by tags:
1. Open the filter popover
2. Select **Tags** from the field dropdown
3. Choose an operator and enter the tag value
4. Click **Apply**
You can combine tag filters with other filters (metadata, model, status) to narrow results further.
The Tags field supports **equals**, **not equals**, and **contains**, a narrower set than most string fields. For a full guide on setting tags, naming conventions, and best practices, see the [Tags documentation](/observe/tags).
## Sessions filtering
The Sessions page has its own filtering and search capabilities:
* **Date range**: the same date range selector as the Traces page (Today, 7d, 30d, 90d, Custom)
* **Search**: search by session ID or session name using the search bar
* **Sort**: sort sessions by cost, total tokens, duration, or trace count by clicking column headers
* **Filter popover**: the same filter builder as the Traces page, with session fields:
* **User ID** (`user_id`): string operators (equals, not equals, contains, not contains, starts with, ends with)
* **Cost (\$)** (`total_cost`), **Tokens** (`total_tokens`), **Latency (ms)** (`latency_ms`): numeric operators
* **Tags** (`tags`): equals, not equals, and contains
For full details on sessions, see the [Sessions documentation](/observe/sessions).
## Saved views
When you apply filters, they appear as removable chips above the results list. Each chip shows the field, operator, and value. Click the **X** on a chip to remove that individual filter without clearing the rest.
## Score filtering
AgentMark automatically detects evaluation score names from your trace data and makes them available as filter fields. This lets you find traces based on quality metrics from your evaluation pipeline.
To filter by score:
1. Open the filter popover
2. Select a score field (for example, **Score: accuracy**)
3. Choose a numeric operator (for example, `>=`)
4. Enter the threshold value (for example, `0.8`)
5. Click **Apply**
Score names are dynamically populated. You only see score fields that exist in your application's trace data.
## Metadata filtering
If you attach custom metadata to your traces (via `agentmark.metadata.*` attributes), those keys are automatically discovered and available as filter fields.
To filter by metadata:
1. Open the filter popover
2. Select a metadata field (for example, **Metadata: environment**)
3. Choose an operator (for example, **equals**)
4. Enter the value (for example, `production`)
5. Click **Apply**
You can also use the `exists` and `does not exist` operators to find traces that have (or lack) a specific metadata key, regardless of value.
Use metadata filters to separate environments, feature flags, A/B test variants, or any other custom dimensions you track.
## Tag filtering
Tags are string labels attached to traces via the SDK for categorization by environment, team, feature, experiment, or release. Tags appear as a column in the trace list and are filterable through the filter popover.
To filter by tags:
1. Open the filter popover
2. Select **Tags** from the field dropdown
3. Choose an operator and enter the tag value
4. Click **Apply**
You can combine tag filters with other filters (metadata, model, status) to narrow results further.
The Tags field supports **equals**, **not equals**, and **contains**, a narrower set than most string fields. For a full guide on setting tags, naming conventions, and best practices, see the [Tags documentation](/observe/tags).
## Sessions filtering
The Sessions page has its own filtering and search capabilities:
* **Date range**: the same date range selector as the Traces page (Today, 7d, 30d, 90d, Custom)
* **Search**: search by session ID or session name using the search bar
* **Sort**: sort sessions by cost, total tokens, duration, or trace count by clicking column headers
* **Filter popover**: the same filter builder as the Traces page, with session fields:
* **User ID** (`user_id`): string operators (equals, not equals, contains, not contains, starts with, ends with)
* **Cost (\$)** (`total_cost`), **Tokens** (`total_tokens`), **Latency (ms)** (`latency_ms`): numeric operators
* **Tags** (`tags`): equals, not equals, and contains
For full details on sessions, see the [Sessions documentation](/observe/sessions).
## Saved views
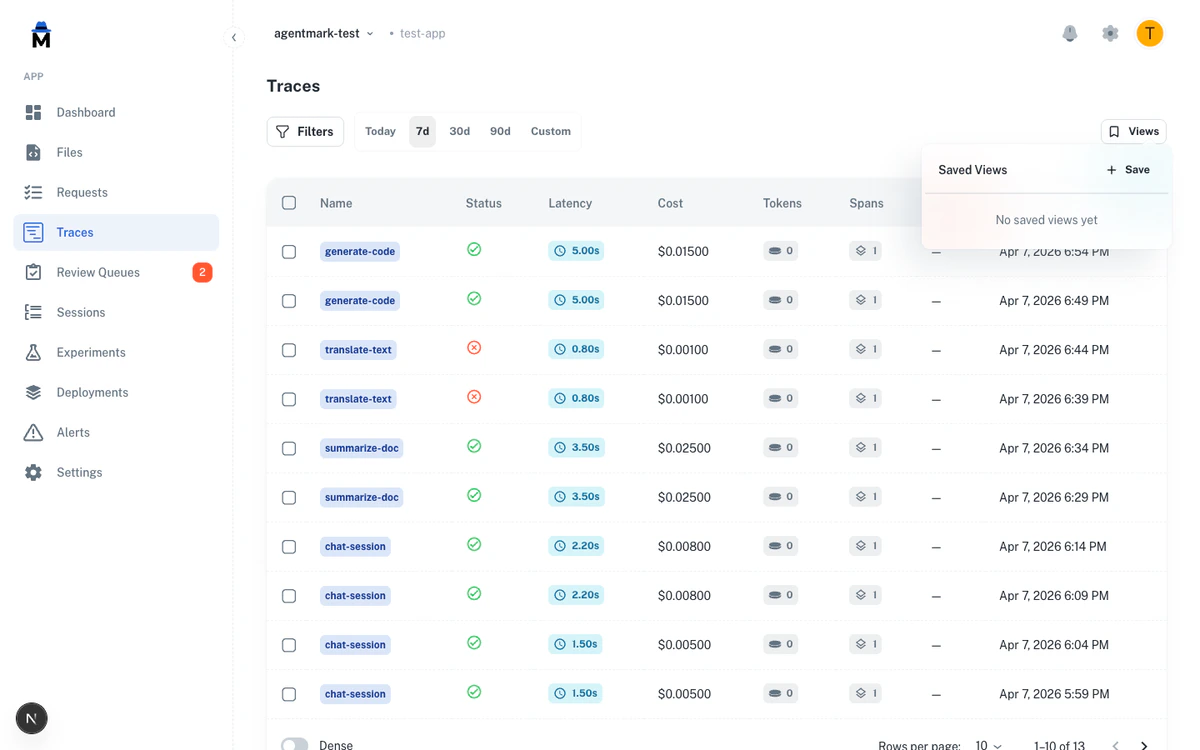 Use the **Views** dropdown to save and restore filter, sort, and date range configurations. Saved views let you quickly switch between commonly used filter sets without rebuilding them each time.
To save a view:
1. Configure your desired filters, sort, and date range
2. Click the **Views** dropdown
3. Select **Save current view**
4. Give the view a name
To restore a view, open the **Views** dropdown and select a previously saved view. Saved views are available on both the Traces and Sessions pages.
## URL parameters
The URL query parameters hold all filter state, including active filters, sort column, sort direction, and date range. This means you can:
* **Bookmark** a filtered view for quick access
* **Share** a URL with teammates to show them the exact same filtered results
* **Link** from alerts, dashboards, or external tools directly to a filtered trace list
When you apply or remove filters, the URL updates automatically. Copy the URL from your browser's address bar to share the current view.
## Filter DSL and search API
The Dashboard filters apply to the Traces and Sessions UI, and the filter builder combines rows with AND only. The API offers the same filtering programmatically, plus OR-groups:
* **Simple query parameters** on `GET /v1/spans` filter by span type, status, model, name, duration range, user, and session. See [Cross-trace span search](/observe/traces-and-logs#cross-trace-span-search) for examples.
* **The `filter` string DSL** on `GET /v1/traces` and `GET /v1/spans` combines predicates with `and` and supports parenthesized OR-groups, for example `(model = "gpt-5" or model = "o3") and status = ERROR`. Operators match the UI builder (`=`, `!=`, `>`, `>=`, `<`, `<=`, `contains`, `not contains`, `starts with`, `ends with`, `exists`, `does not exist`), over fields including `trace_id`, `props`, `metadata.`, and `score__`.
* **Structured JSON search** via `POST /v1/traces/search`, `POST /v1/spans/search`, and `POST /v1/scores/search` adds `in`, `notIn`, and `between` operators that have no string-DSL syntax.
* **`GET /v1/filter-schema`** returns a machine-readable list of filterable fields and operators per resource. Fetch it once before constructing filters programmatically.
The same operations are available as MCP tools via the [`agentmark-mcp`](/coding-agents/gateway-mcp) server. See the [API reference](/api-reference/overview) for the full grammar and request schemas.
## Next steps
Understand trace details and span attributes
Group related traces together
Track usage, costs, and performance
Get notified of critical issues
Use the **Views** dropdown to save and restore filter, sort, and date range configurations. Saved views let you quickly switch between commonly used filter sets without rebuilding them each time.
To save a view:
1. Configure your desired filters, sort, and date range
2. Click the **Views** dropdown
3. Select **Save current view**
4. Give the view a name
To restore a view, open the **Views** dropdown and select a previously saved view. Saved views are available on both the Traces and Sessions pages.
## URL parameters
The URL query parameters hold all filter state, including active filters, sort column, sort direction, and date range. This means you can:
* **Bookmark** a filtered view for quick access
* **Share** a URL with teammates to show them the exact same filtered results
* **Link** from alerts, dashboards, or external tools directly to a filtered trace list
When you apply or remove filters, the URL updates automatically. Copy the URL from your browser's address bar to share the current view.
## Filter DSL and search API
The Dashboard filters apply to the Traces and Sessions UI, and the filter builder combines rows with AND only. The API offers the same filtering programmatically, plus OR-groups:
* **Simple query parameters** on `GET /v1/spans` filter by span type, status, model, name, duration range, user, and session. See [Cross-trace span search](/observe/traces-and-logs#cross-trace-span-search) for examples.
* **The `filter` string DSL** on `GET /v1/traces` and `GET /v1/spans` combines predicates with `and` and supports parenthesized OR-groups, for example `(model = "gpt-5" or model = "o3") and status = ERROR`. Operators match the UI builder (`=`, `!=`, `>`, `>=`, `<`, `<=`, `contains`, `not contains`, `starts with`, `ends with`, `exists`, `does not exist`), over fields including `trace_id`, `props`, `metadata.`, and `score__`.
* **Structured JSON search** via `POST /v1/traces/search`, `POST /v1/spans/search`, and `POST /v1/scores/search` adds `in`, `notIn`, and `between` operators that have no string-DSL syntax.
* **`GET /v1/filter-schema`** returns a machine-readable list of filterable fields and operators per resource. Fetch it once before constructing filters programmatically.
The same operations are available as MCP tools via the [`agentmark-mcp`](/coding-agents/gateway-mcp) server. See the [API reference](/api-reference/overview) for the full grammar and request schemas.
## Next steps
Understand trace details and span attributes
Group related traces together
Track usage, costs, and performance
Get notified of critical issues
Have questions?
Reach out any time: