Paid feature. Alerts are available on Growth, Team, and Enterprise plans in the AgentMark Dashboard. They’re not available on the Hobby (free) tier.
Developers configure webhook endpoints. See Webhook documentation for setup instructions.
Overview
Alerts help you:- Monitor important metrics like cost, latency, and error rates
- Set thresholds for acceptable values
- Define time windows for measurement
- Receive notifications via Slack or webhooks
- Track alert history to analyze patterns
Available metrics
Creating alerts
To create a new alert:- Navigate to your app’s Alerts tab in the Dashboard
- Click Create Alert
- Configure the alert:
- Name: descriptive name for the alert
- Metric: what to monitor. AgentMark validates thresholds per metric: error rate 0-100 (percent), latency a positive integer in milliseconds, cost greater than 0 (dollars), evaluation score between 0 and 1
- Threshold: value that triggers the alert
- Time window: period over which AgentMark measures the metric, between 5 and 100 minutes
- Evaluation name (for score alerts): specific score to monitor
- Aggregation type (for score alerts): average or individual scores
- Threshold direction (for score alerts): alert above or below threshold
Notification options
Slack integration
Receive alerts directly in Slack:- Connect Slack and pick the notification channel in Settings → Integrations. The channel binding is per environment, so each environment can post to its own channel
- Enable the Slack Notifications toggle when creating an alert
Webhooks
For custom integrations:- Configure your webhook endpoint in Settings → Integrations (per environment)
- Enable the Custom Webhook toggle when creating an alert
- Receive alerts as HTTP POST requests with alert details
Alerts API
You can also create and manage alerts programmatically through/v1/alerts (CRUD, trigger history, and Slack channel listing). See the API reference.
Alert status
Alerts have two states:- Triggered: the monitored metric has crossed the threshold.
- Resolved: the metric has returned to the acceptable side of the threshold.
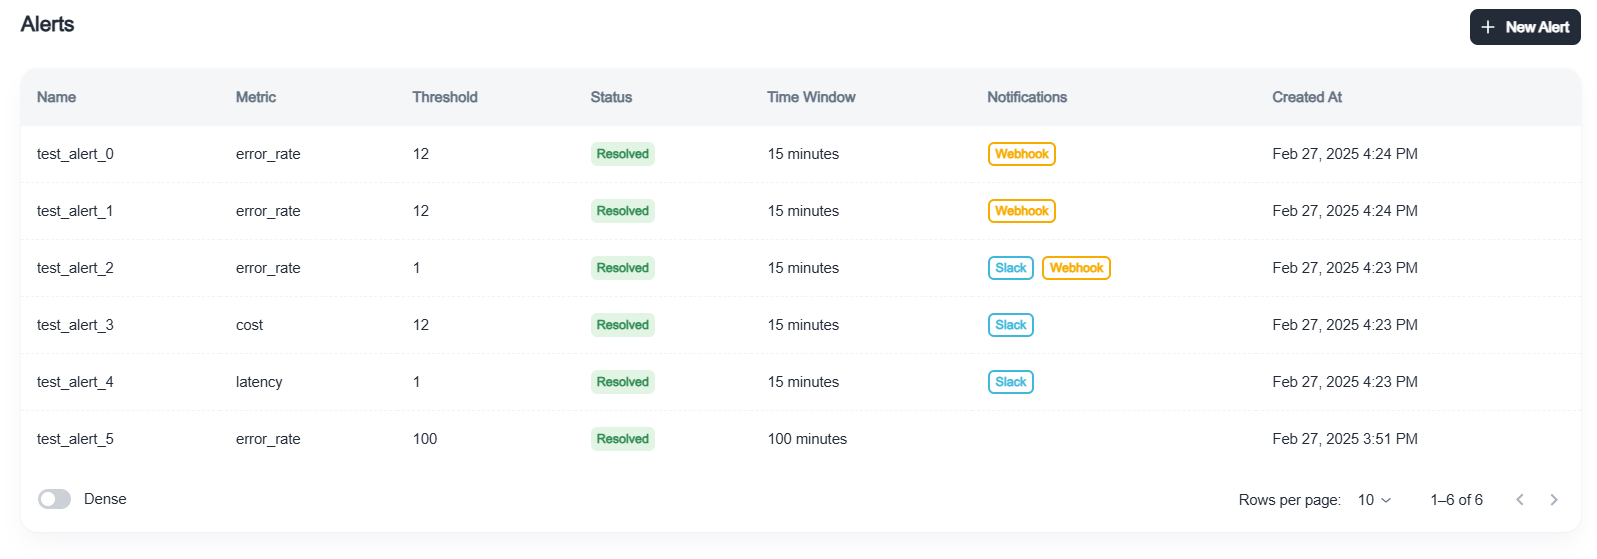
Alert history
View alert history to analyze patterns:- Navigate to the Alerts tab
- Click an alert to see when it triggered, the value that triggered it, when it resolved, and how frequently it fires
Use cases
- Cost management: get notified when daily spending exceeds budget
- Performance monitoring: alert when latency degrades beyond acceptable levels
- Quality assurance: track when evaluation scores drop below quality thresholds
- Error detection: catch error rate spikes before they impact users
Best practices
- Set thresholds from your baseline. Start above your observed normal range, then tighten as you learn your traffic.
- Choose appropriate windows to match your usage patterns and avoid alert fatigue.
- Configure multiple channels. Use Slack plus a webhook for critical alerts.
- Revisit thresholds as your usage patterns evolve.
Next steps
Traces and logs
Monitor prompt execution
Sessions
Track user interactions
Dashboards
View overall performance
Evaluations
Set up evaluation alerts
Have questions?
Reach out any time:
- Email the team at hello@agentmark.co for support
- Schedule an Enterprise Demo to learn about AgentMark’s business solutions