Users are tracked by the
userId field passed to the SDK’s trace() function. See Development documentation for setup instructions.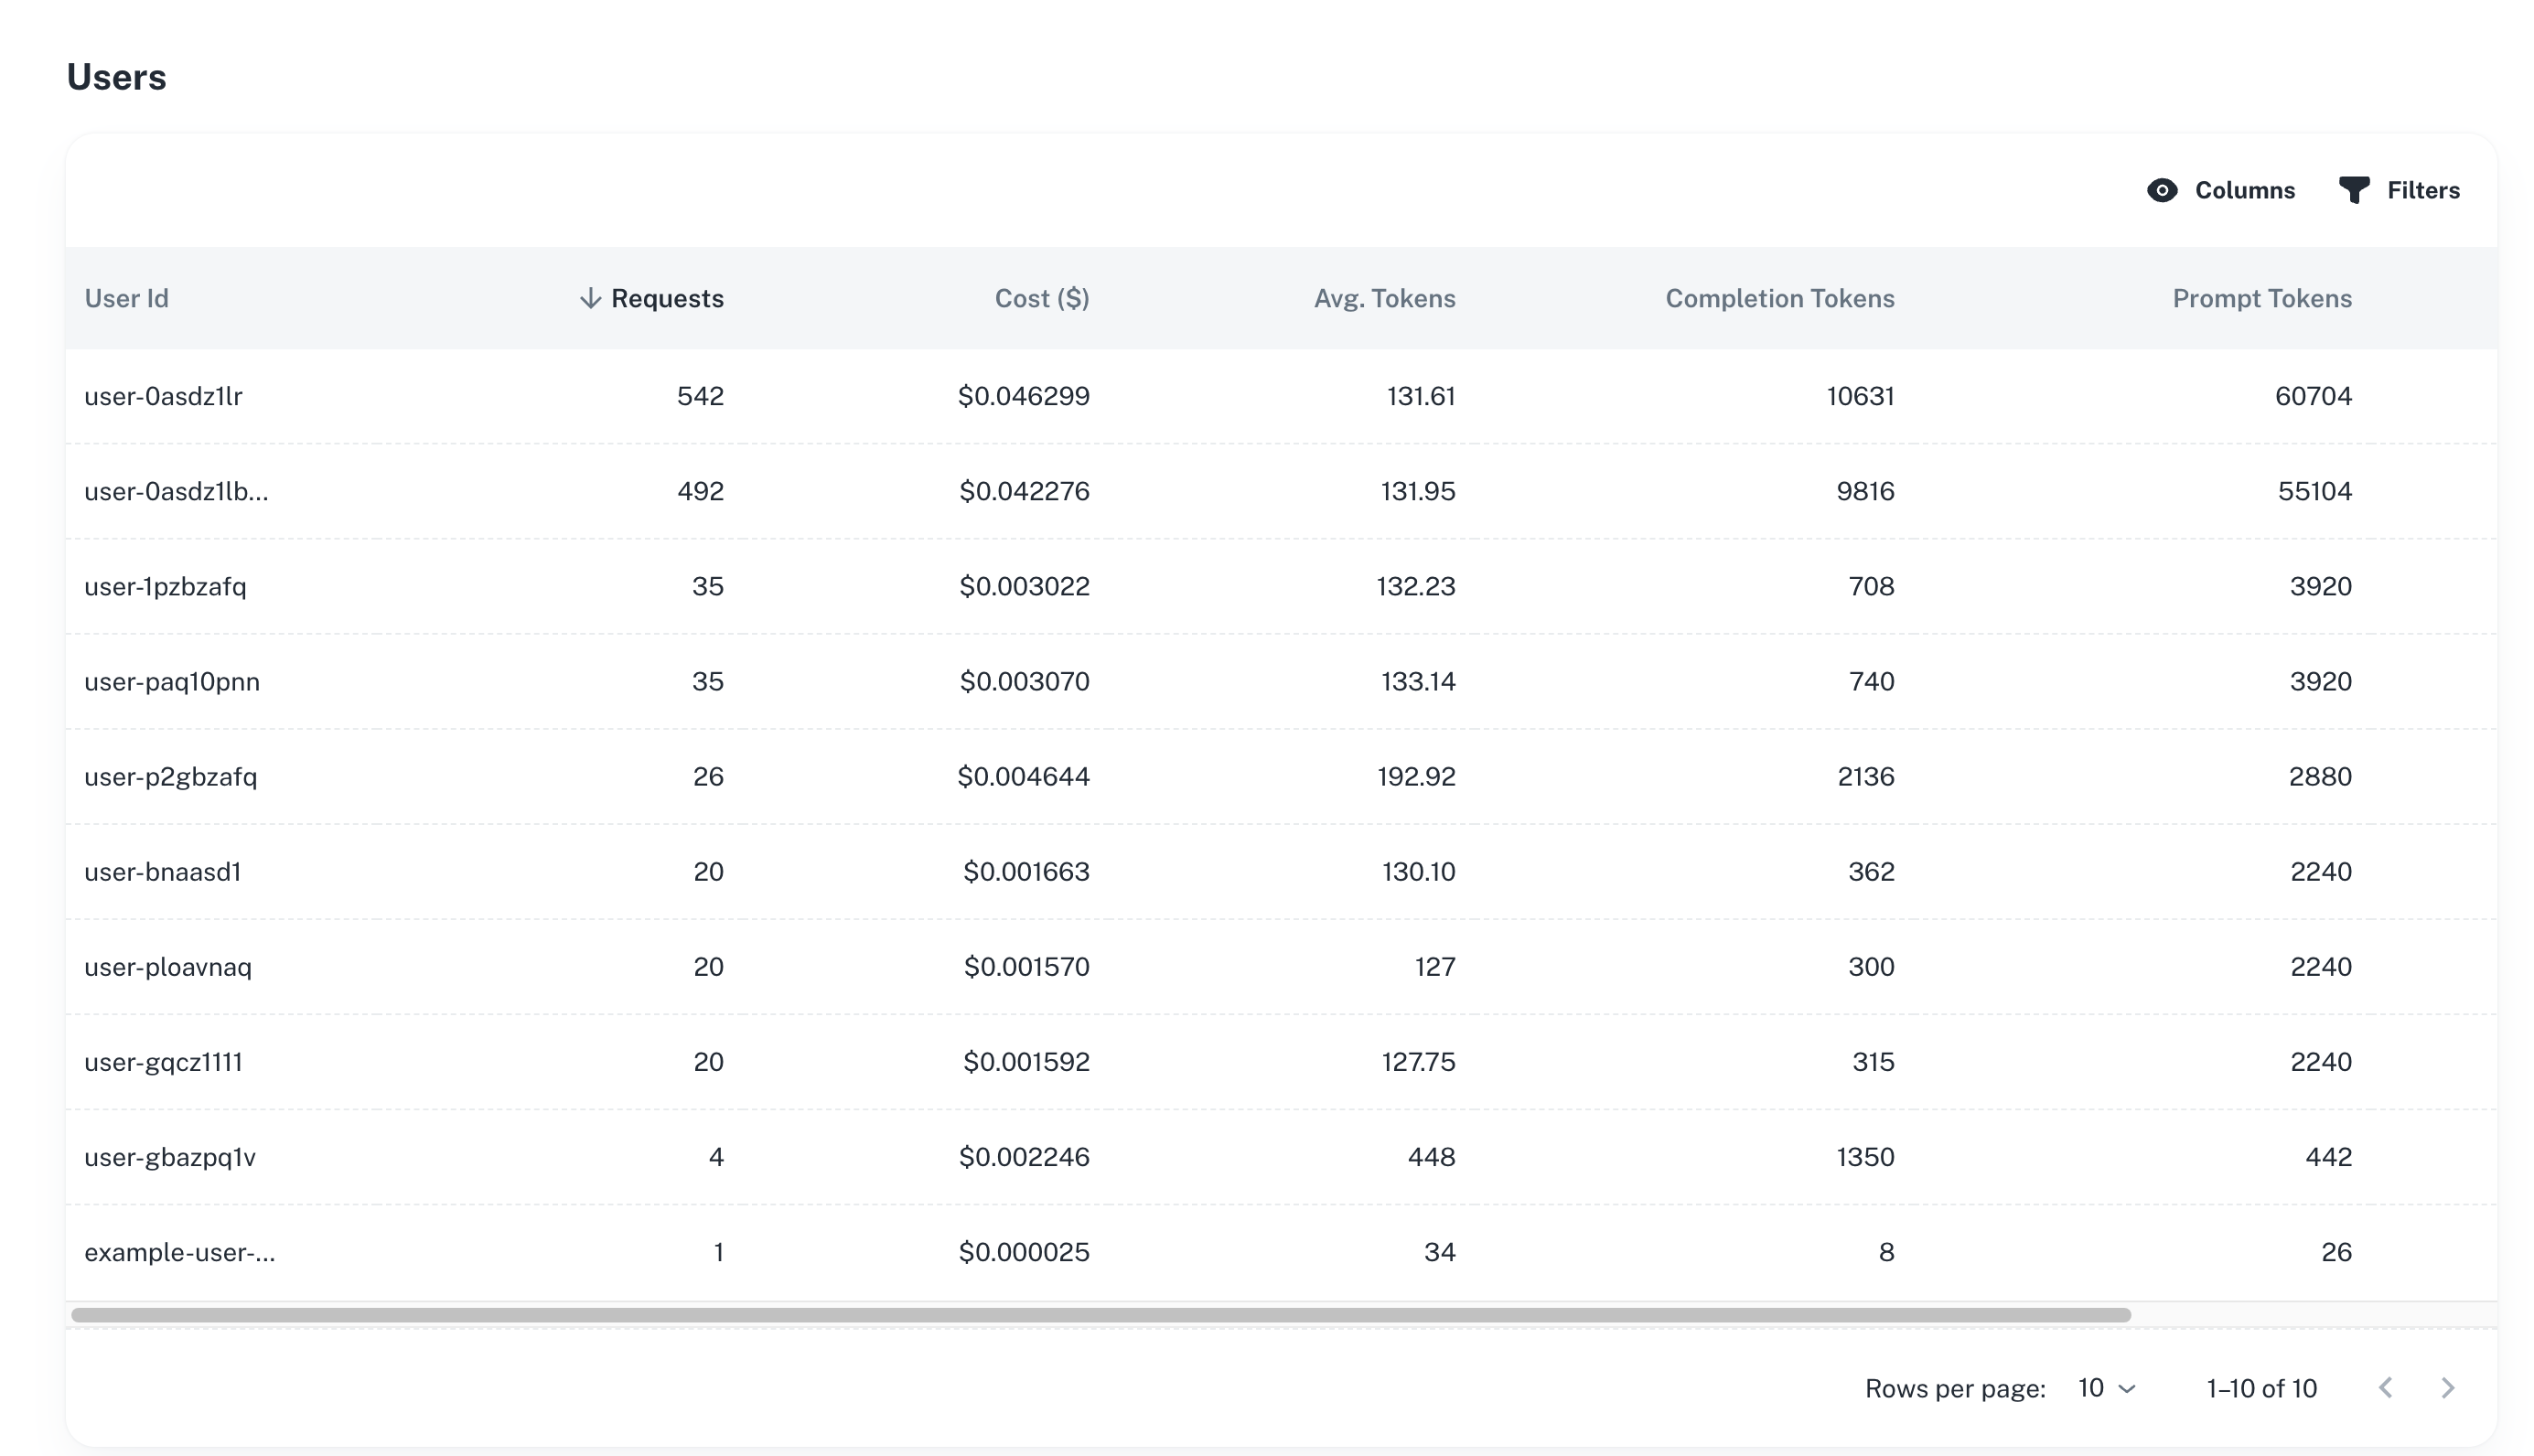
Overview
Track detailed metrics for each user including:- Total requests and costs
- Average latency
- Token consumption
- Recent activity
- Error rates
User Activity
Active Users - Track unique users over time Request Volumes - See how many requests each user makes Usage Patterns - Identify when users are most active Engagement Trends - Monitor user activity over timeCost Attribution
Per-User Costs - Track spending by individual user Cost Trends - See how user costs change over time Budget Alerts - Set alerts for high-cost users Billing Analysis - Understand costs for reporting and billingPerformance Tracking
Latency by User - Average response times per user Token Usage - Input and output tokens per user Model Usage - Which models each user is accessing Error Rates - Track failures by userUse Cases
Customer Success - Identify power users and ensure they have a good experience Cost Management - Find high-cost users and optimize their usage Support - Debug issues for specific users by viewing their activity Product Analytics - Understand usage patterns to improve features Billing - Attribute costs to customers for usage-based pricingBest Practices
Monitor Regularly - Check user metrics to identify trends early Set Thresholds - Alert on unusual activity or high costs Correlate with Traces - Investigate specific user sessions and traces Track Cohorts - Group users by signup date or other attributes Export Data - Download user metrics for custom analysisNext Steps
Metrics
View overall application metrics
Sessions
Track user sessions
Traces and Logs
View individual user requests
Alerts
Set up user-based alerts
Have Questions?
We’re here to help! Choose the best way to reach us:
- Join our Discord community for quick answers and discussions
- Email us at hello@agentmark.co for support
- Schedule an Enterprise Demo to learn about our business solutions