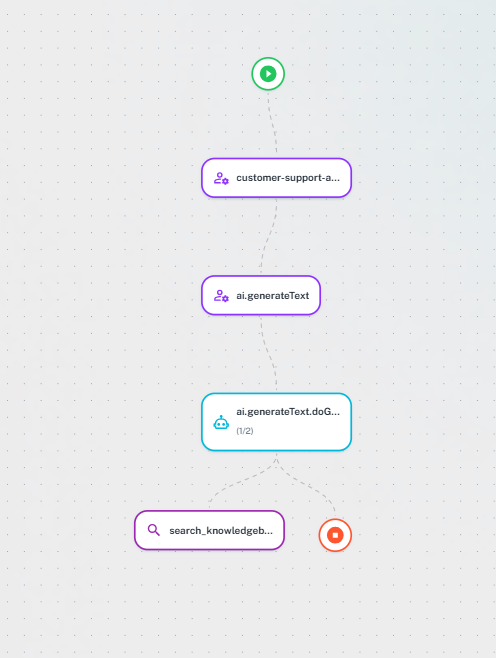
Graph View
Interactive visualization of AI agent workflows showing component relationships, execution flow, and data dependencies.Graph metadata is added by developers during trace creation. See Development documentation for implementation details.
When to Use
Complex workflows - Multi-step agents, conditional logic, parallel operations Debugging - Trace errors, identify bottlenecks, understand behavior Optimization - Find redundant operations, parallelization opportunities Documentation - Explain architecture, train team membersHow Graphs Are Generated
AgentMark supports two graph generation modes: Manual mode — When spans includegraph.node.* metadata attributes, the graph is built from those explicit relationships. This gives you full control over the layout and node classification.
Auto-generation mode — When no graph metadata is present, nodes are grouped automatically by parent span and span name. Node types are inferred from span content (e.g., generation spans become LLM nodes, spans with tool calls become Tool nodes).
Graph Metadata Attributes
Set these attributes in your span metadata to control the graph layout:| Attribute | Description |
|---|---|
graph.node.id | Unique node identifier |
graph.node.type | Node type for styling (see Node Types below) |
graph.node.display_name | Human-readable label shown in the graph |
graph.node.parent_id | Single parent node ID |
graph.node.parent_ids | JSON array of parent node IDs (for nodes with multiple parents) |
Node Types
| Type | Icon | Description |
|---|---|---|
| Router | Branch icon | Orchestration and routing decisions |
| LLM | Robot icon | Model inference, shows model name and tokens |
| Tool | Wrench icon | Function calls, shows duration and status |
| Retrieval | Magnify icon | Database or search queries |
| Memory | Database icon | Storage and caching operations |
| Agent | Account icon | Multi-step agent reasoning |
- LLM — Span is a generation type
- Tool — Span contains tool call data
- Agent — Span has child spans (sub-workflows)
- Name-based — Span name contains keywords like
retrieval,router,memory, ortool
Edge Types
Sequential — Solid lines showing step-by-step execution Parallel — Multiple edges from same source (concurrent operations) Conditional — Labeled edges showing which branch was taken Data Flow — Shows data passing between nodes Bidirectional edges (A → B and B → A) are displayed as a single edge with arrows on both ends.Interactive Features
Navigation — Drag to pan, scroll to zoom, double-click to center, fit-to-screen button Node Details — Click nodes to see inputs, outputs, execution time, tokens, errors Path Highlighting — Show critical path (bottlenecks), error paths, or data flowKeyboard Shortcuts
Space + Drag pan | +/- zoom | F fit | Click select | H/V/C layouts
Next Steps
Traces and Logs
Detailed trace information
Sessions
Group related traces together
Metrics
Analyze aggregate performance
Alerts
Set up notifications for issues
Have Questions?
We’re here to help! Choose the best way to reach us:
- Join our Discord community for quick answers and discussions
- Email us at hello@agentmark.co for support
- Schedule an Enterprise Demo to learn about our business solutions