Templates
Start from a pre-built template or create a blank dashboard. Select a template from the gallery to instantly populate your dashboard with relevant widgets.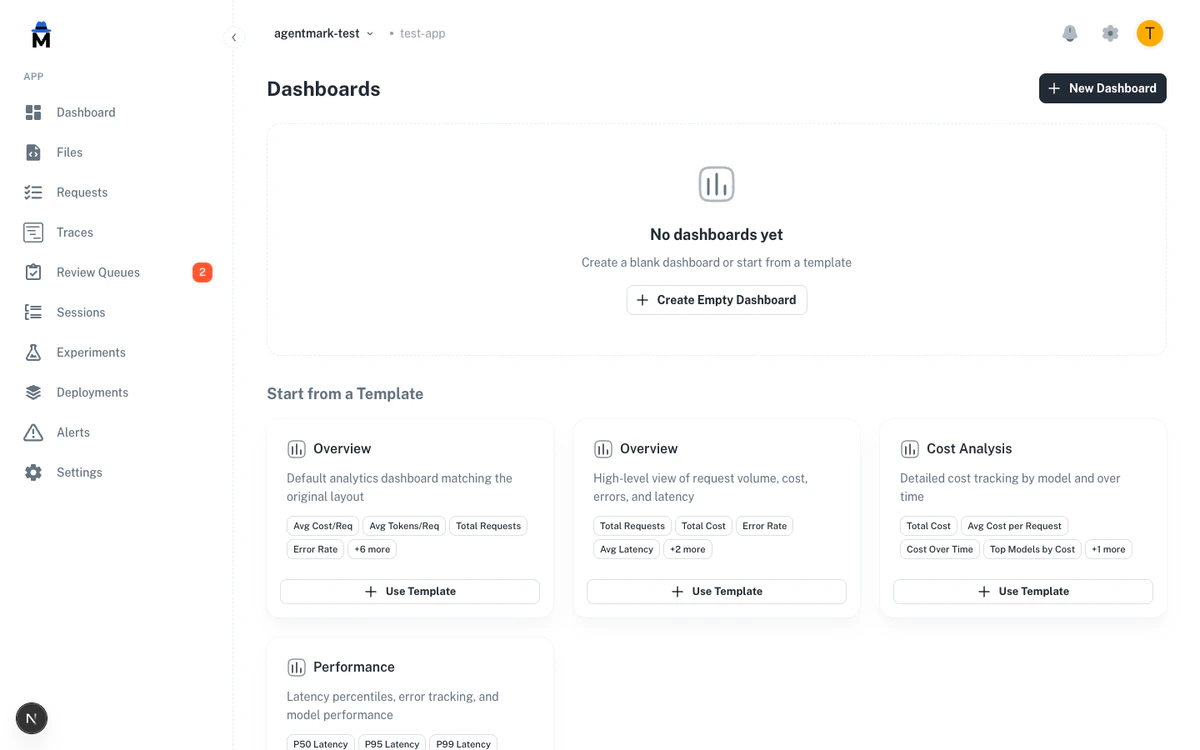
- Overview — high-level view of request volume, cost, errors, and latency with stat cards and time series charts
- Cost Analysis — detailed cost tracking with total cost, average cost per request, cost over time, top models by cost, and token trends
- Performance — latency percentiles (P50, P95, P99), error count, error rate, and average latency
Widget types
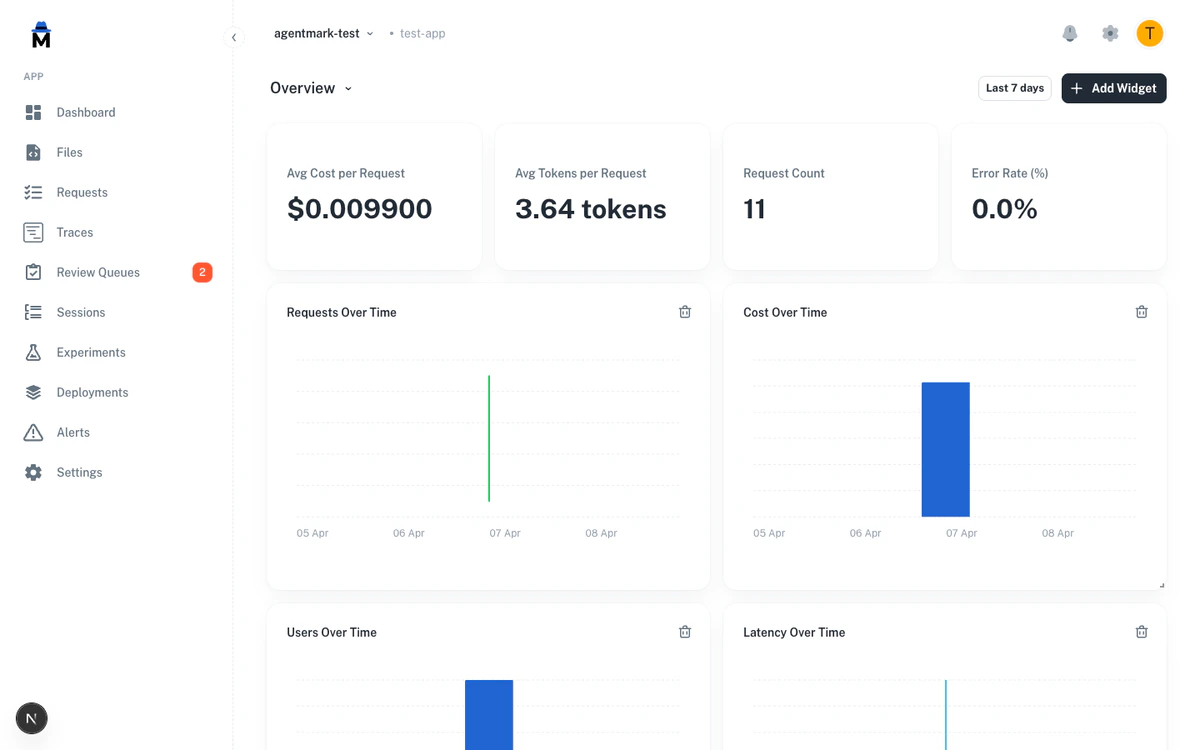
Each widget displays a single metric using one of the following visualization types:- Stat card — a single metric value, optionally showing the change over the previous period (direction: up, down, or flat)
- Line chart — a metric plotted over time, useful for trends and patterns
- Bar chart — a metric grouped by a dimension such as model or user, useful for comparisons and top-N rankings
- Area chart — similar to a line chart with a filled area beneath, useful for volume-based metrics
Available metrics
AgentMark Custom Dashboards support the following built-in metrics: Volume and usage:request_count— total number of requestsunique_users— count of distinct userstotal_tokens— total tokens consumedavg_tokens— average tokens per request
total_cost— total dollar costavg_cost— average cost per request
error_count— total number of errorserror_rate— percentage of requests that failed
avg_latency— average response time in millisecondsp50_latency— 50th percentile latencyp95_latency— 95th percentile latencyp99_latency— 99th percentile latency
top_models— model usage ranked by request count
Creating a dashboard and adding widgets
- Navigate to your app and click the Dashboards tab
- Click + New Dashboard or select Use Template from the template gallery
- The dashboard opens with your widgets — click + Add Widget to add more
- Configure the widget: choose a title, metric, visualization type, and optional group-by dimension
- Click Add Widget to place it on the dashboard
Customizing widgets
Each widget can be configured with the following options:- Metric — the data point to display (see Available metrics)
- Visualization — how to render the data (stat, line, bar, or area)
- Group by — an optional dimension to segment the data by model, user, time period, or a custom metadata key
- Time granularity — hour, day, or auto (automatically selected based on the date range)
- Filters — narrow the widget’s data by model, user ID, status, or metadata values
Dashboard settings
- Default dashboard — mark a dashboard as the default to load it automatically when you visit the Dashboards tab
- Global time range — set a time range that applies to all widgets in the dashboard (24 hours, 7 days, 30 days, 90 days, or custom)
- Limits — each app supports up to 10 dashboards, with a maximum of 20 widgets per dashboard
Next steps
Metrics
View aggregate usage and performance metrics
Cost & Tokens
Monitor spending and token usage
Alerts
Get notified of critical metric thresholds
Filtering and Search
Find specific traces across dimensions
Have Questions?
We’re here to help! Choose the best way to reach us:
- Email us at hello@agentmark.co for support
- Schedule an Enterprise Demo to learn about our business solutions