

/v1/evals routes. In Local, you keep datasets as JSONL files alongside your prompts, write eval functions in code, and run experiments from the CLI.
Why test prompts?
LLM outputs are non-deterministic. The same prompt can produce different results. Testing helps you:- Catch regressions: know when prompt changes break existing functionality
- Validate quality: confirm outputs meet your standards across varied scenarios
- Measure improvements: quantify whether prompt iterations actually perform better
- Build confidence: deploy changes backed by data, not guesswork
Testing workflow
- Cloud
- Local
1
Define a dataset in your repo
Add a JSONL file to your
agentmark/ directory. Each line is one test case.2
Declare score configs and write evals
Add score configs to
agentmark.json under scores, and register eval functions on the client that backs your deployed handler.3
Deploy to sync
Push to your connected branch. The deployment pipeline syncs your datasets and score configs to AgentMark Cloud.
4
Run an experiment
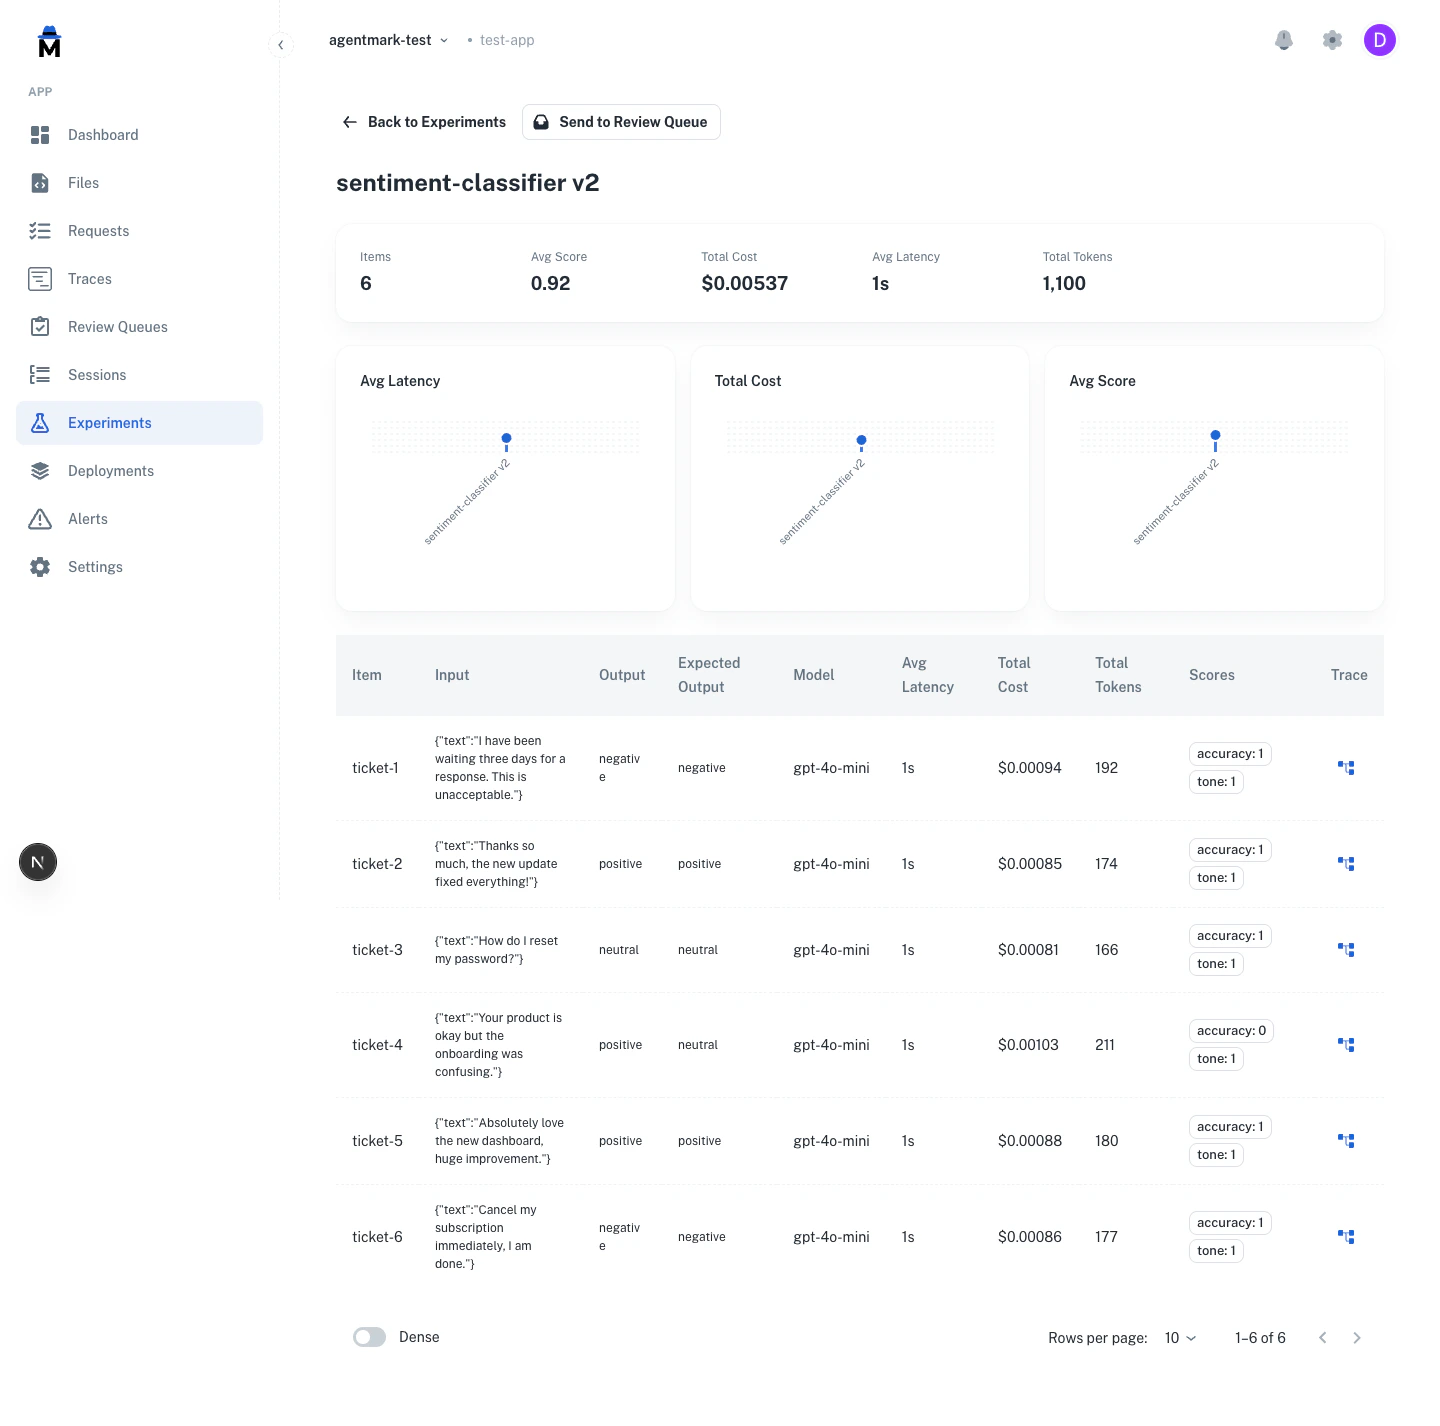
Open Experiments in the Dashboard, click New Experiment, choose the prompt, dataset, and evaluations, and run. Results stream in live, then open in the experiment detail view.
Core concepts
Datasets
A dataset is a set of test inputs, each with an optional expected output, that you run your prompt against. Cover the scenarios it has to handle: common cases, edge cases, and failure modes.- Cloud
- Local
Datasets live as JSONL files in your repo and sync to AgentMark Cloud through the deployment pipeline. In the Dashboard you pick a synced dataset when you create an experiment or configure a review queue. The Add to Dataset flow during annotation review and the REST API both append rows.
Evaluations
An evaluation (eval) is a function you write that scores a prompt’s output and returns pass or fail. Each eval is your definition of a good output, in code: for example, “the classification matches the expected label.”- Cloud
- Local
You declare score configs in
agentmark.json under scores, and the deployment pipeline syncs them to AgentMark Cloud. Eval functions run during experiments on your deployed handler. In the New Experiment dialog you select which registered evals to run, and results appear as per-row scores and aggregates in the experiment detail view.Experiments
An experiment runs a prompt against a dataset and scores each row with your evals. Run one to check a prompt change, compare model configurations, or gate a deploy on a pass-rate threshold.- Cloud
- Local
Run experiments from the Experiments page in the Dashboard. Review results with per-row score drill-down, aggregate metrics, and charts, and compare runs side by side.
Annotations
Cloud feature. Annotations are available in the AgentMark Dashboard.
Testing strategies
- Start small (5-10 cases), then grow with real data
- Test multiple dimensions: accuracy, completeness, tone, format
- Version control everything: datasets live alongside prompts in your repo
- Run in CI/CD: gate deployments on pass-rate thresholds
Programmatic access
Query datasets, experiments, runs, and prompt execution logs through the REST API, or from an IDE agent via theagentmark-mcp MCP server. Use either to build custom reporting, export evaluation results to external tools, or integrate experiment data into CI/CD pipelines.
/v1/* wire contract. A small number of routes are environment-specific. See the Where column in API reference → Available endpoints.
Next steps
Datasets
Create test datasets
Writing evals
Write evaluation functions
Running experiments
Execute tests with the CLI or Dashboard
Annotations
Human-in-the-loop scoring
Have questions?
Reach out any time:
- Email the team at hello@agentmark.co for support
- Schedule an Enterprise Demo to learn about AgentMark’s business solutions