

Cloud feature. Dashboards are available in the AgentMark Dashboard.
Set up tracing in your application before any dashboards populate. See the Observe overview for the integration steps.
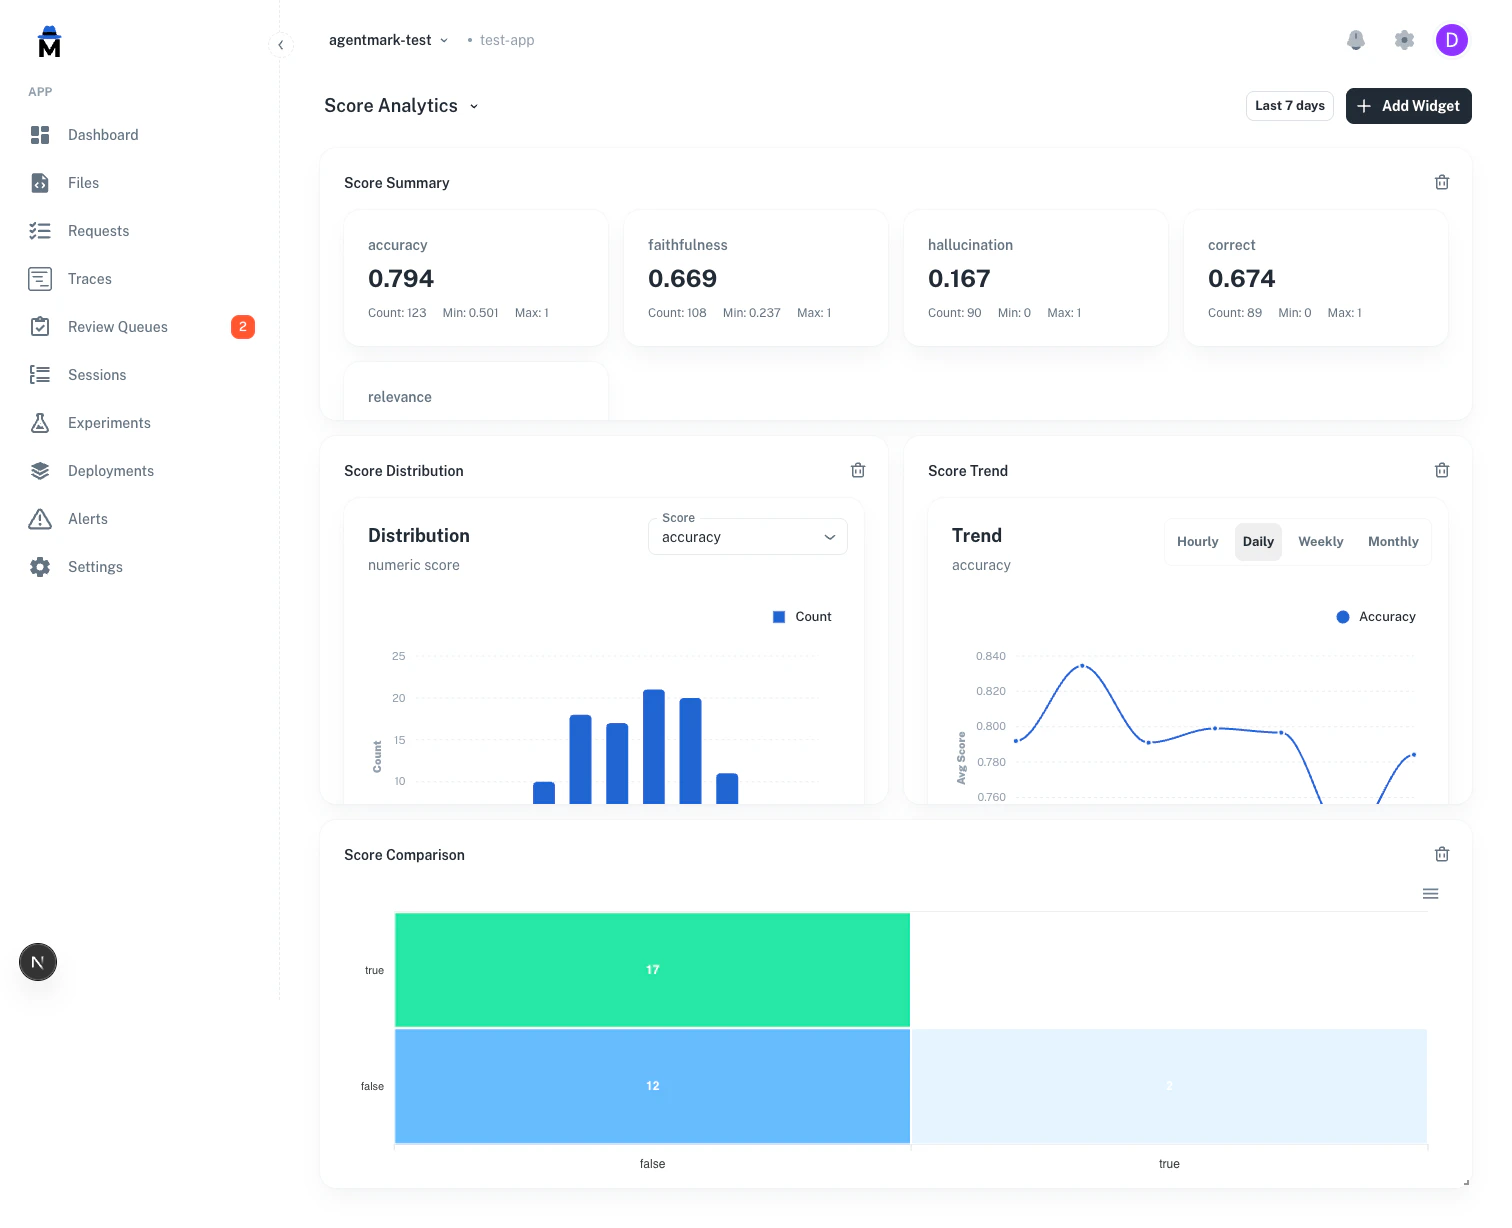
Operational metrics
The Dashboard automatically tracks key metrics from your prompt executions:| Category | Metrics |
|---|---|
| Cost | Total cost, average cost per request, cost by model |
| Latency | Average latency, P50/P95/P99 percentiles, latency trends |
| Tokens | Input tokens, output tokens, total tokens, tokens by model |
| Volume | Request count, error count, error rate, unique users |
| Models | Request count per model, cost per model, top models ranking |
Score analytics
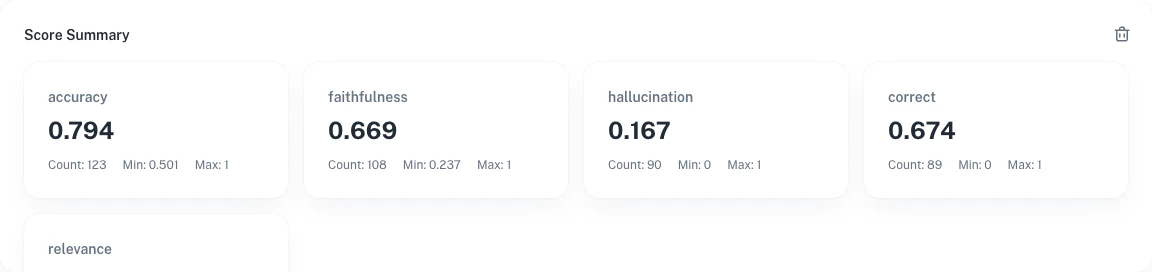
Score analytics are available as dashboard widgets. Add them to any dashboard through the “Add widget” dialog, or start from the Score analytics template in the template gallery. Four score widget types are available:Summary cards
Aggregated statistics for each score name:- Avg: Mean score value
- Count: Total number of scores recorded
- Min / Max: Range of observed values
Score distribution
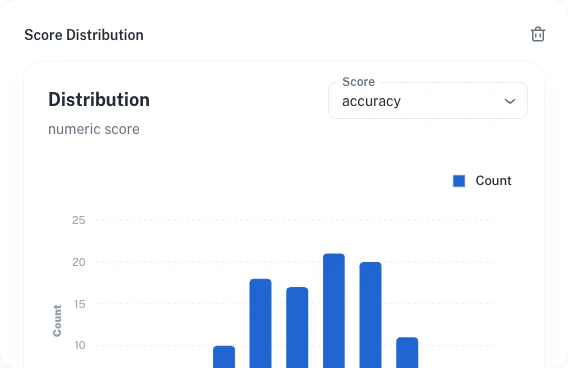
The histogram shows the distribution of score values. AgentMark auto-detects the score type:- Numeric scores: 10 equal-width bins between min and max
- Categorical scores: Bar chart by category label
- Boolean scores: Two bars for true/false
Trend over time
Average score values over time, bucketed by the dashboard’s selected time granularity.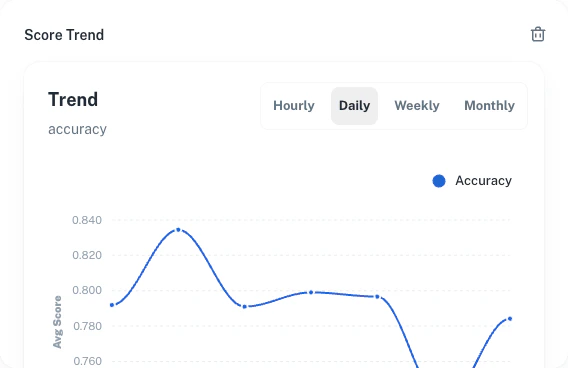
Score comparison
Compare two scores of the same type to see how they align across shared traces:- Categorical / Boolean: Confusion matrix (N×M heatmap)
- Numeric: Scatter plot with paired values
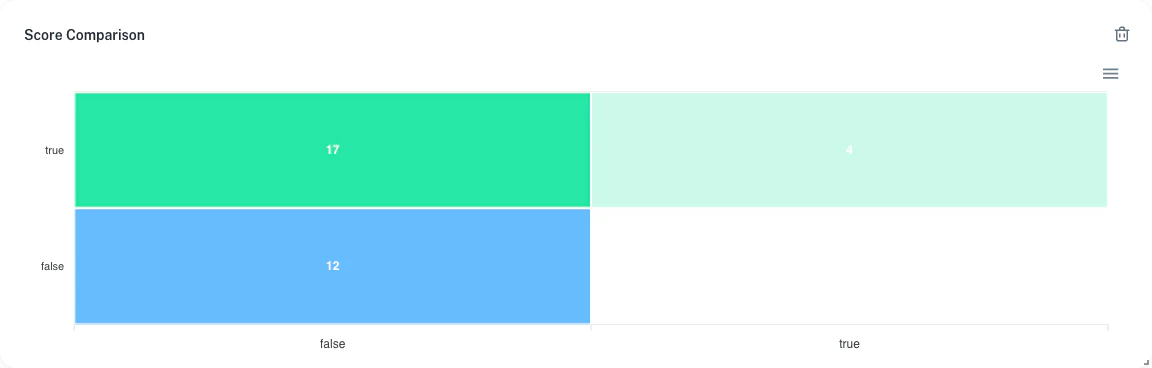
Both scores must be the same type. Mixing numeric with categorical shows an error. The scatter plot shows at most 10,000 data points for performance.
Score types
| Score type | Detection rule | Distribution | Comparison |
|---|---|---|---|
| Numeric | Float values, no labels | 10-bin histogram | Scatter plot |
| Categorical | String labels (not just true/false) | Category bar chart | N×M confusion matrix |
| Boolean | Labels are only “true” and/or “false” | Two-bar chart | 2×2 confusion matrix |
Widgets
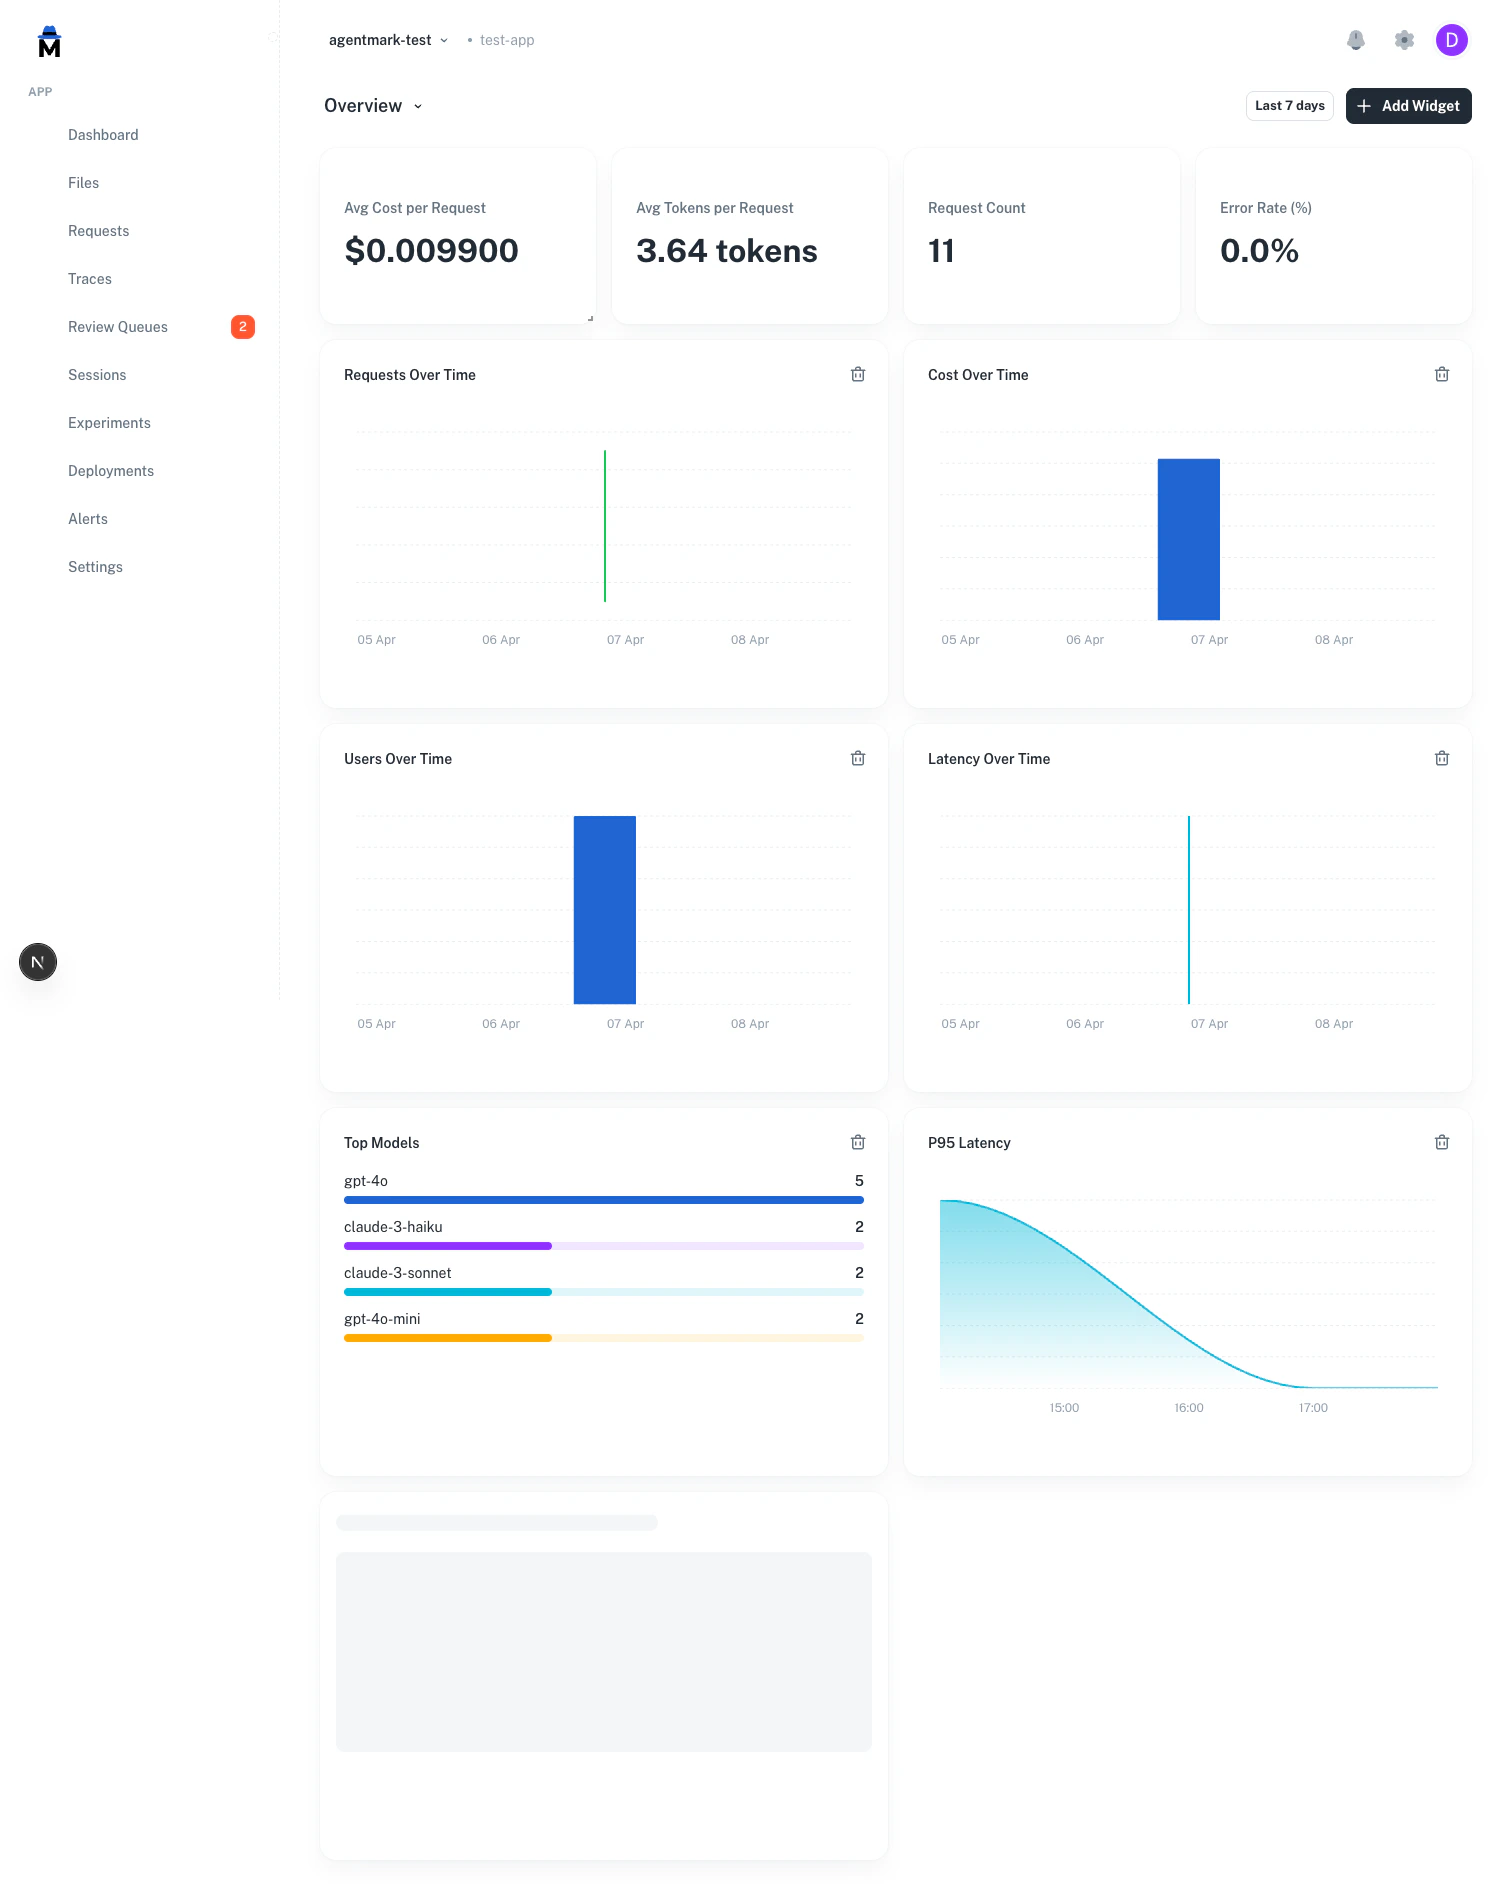
Dashboards are configurable with drag-and-drop widgets. Add any mix of operational and score widgets to build the view you want. Operational widgets (stat card, line, bar, or area chart):- Request count, error rate, cost, latency, tokens, unique users, model rankings
- Derived metrics: cost/request, tokens/request, success rate, and more
- Score summary: aggregated stats for all scores
- Score distribution: histogram or category chart for a selected score
- Score trend: trend line over time for a selected score
- Score comparison: confusion matrix or scatter plot comparing two scores
Available metrics
Volume:request_count, unique_users, total_tokens, avg_tokens
Cost: total_cost, avg_cost
Errors: error_count, error_rate
Latency: avg_latency, p50_latency, p95_latency, p99_latency
Rankings: top_models
Adding widgets
- Click + Add widget in the dashboard header
- Choose a title and metric. Operational metrics are under “Built-in” and “Derived”; score metrics are under “Scores”
- For score widgets, enter the score name(s) to track
- Choose a visualization type and optional group-by dimension
- The widget appears on the grid. Drag to rearrange
Templates
Start from a pre-built template or create a blank dashboard.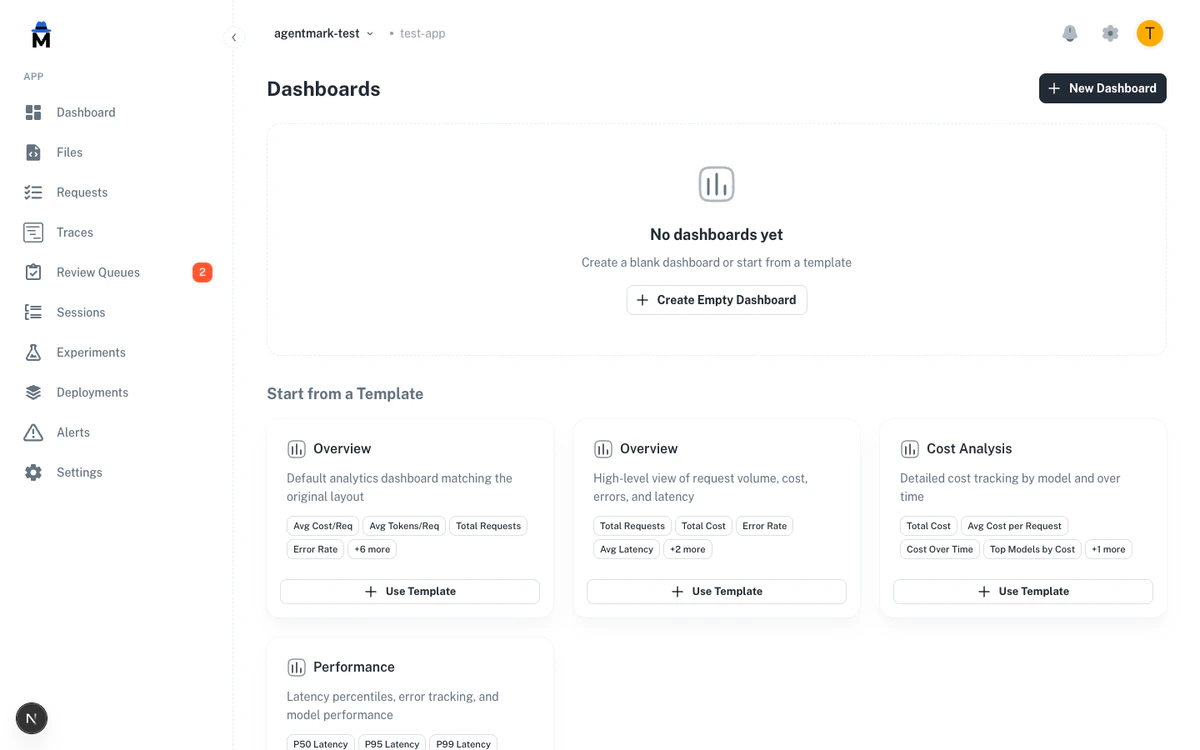
| Template | What it includes |
|---|---|
| Overview | Request volume, cost, errors, latency (stat cards + time series) |
| Cost analysis | Total cost, avg cost/request, cost over time, top models by cost, tokens |
| Performance | P50/P95/P99 latency, error count, error rate |
| Score analytics | Score summary, distribution, trend, and comparison widgets |
Dashboard settings
- Default dashboard: mark any dashboard as default to load it when you visit the Dashboards page
- Time range: a global selector that applies to all widgets on the dashboard
Metrics API
You can retrieve aggregated operational metrics programmatically using the public REST API. TheGET /v1/metrics endpoint returns a summary and an hourly time series for trace volume, latency, cost, token usage, and error rates.
start_date and end_date (ISO 8601). Pass extended=true for per-request averages and model count. See the Metrics API reference for the full response schema.
Scores API
You can create and retrieve scores programmatically using the public REST API. This is useful for recording evaluation results, human feedback, or quality metrics from automated pipelines. Create a score for a span or trace:Next steps
Set up Alerts to get notified when the metrics on your dashboards cross a threshold, or dig into individual requests in Traces and logs.Have questions?
Reach out any time:
- Email the team at hello@agentmark.co for support
- Schedule an Enterprise Demo to learn about AgentMark’s business solutions