

Set up tracing in your application before traces appear here. See Tracing setup for the integration steps.
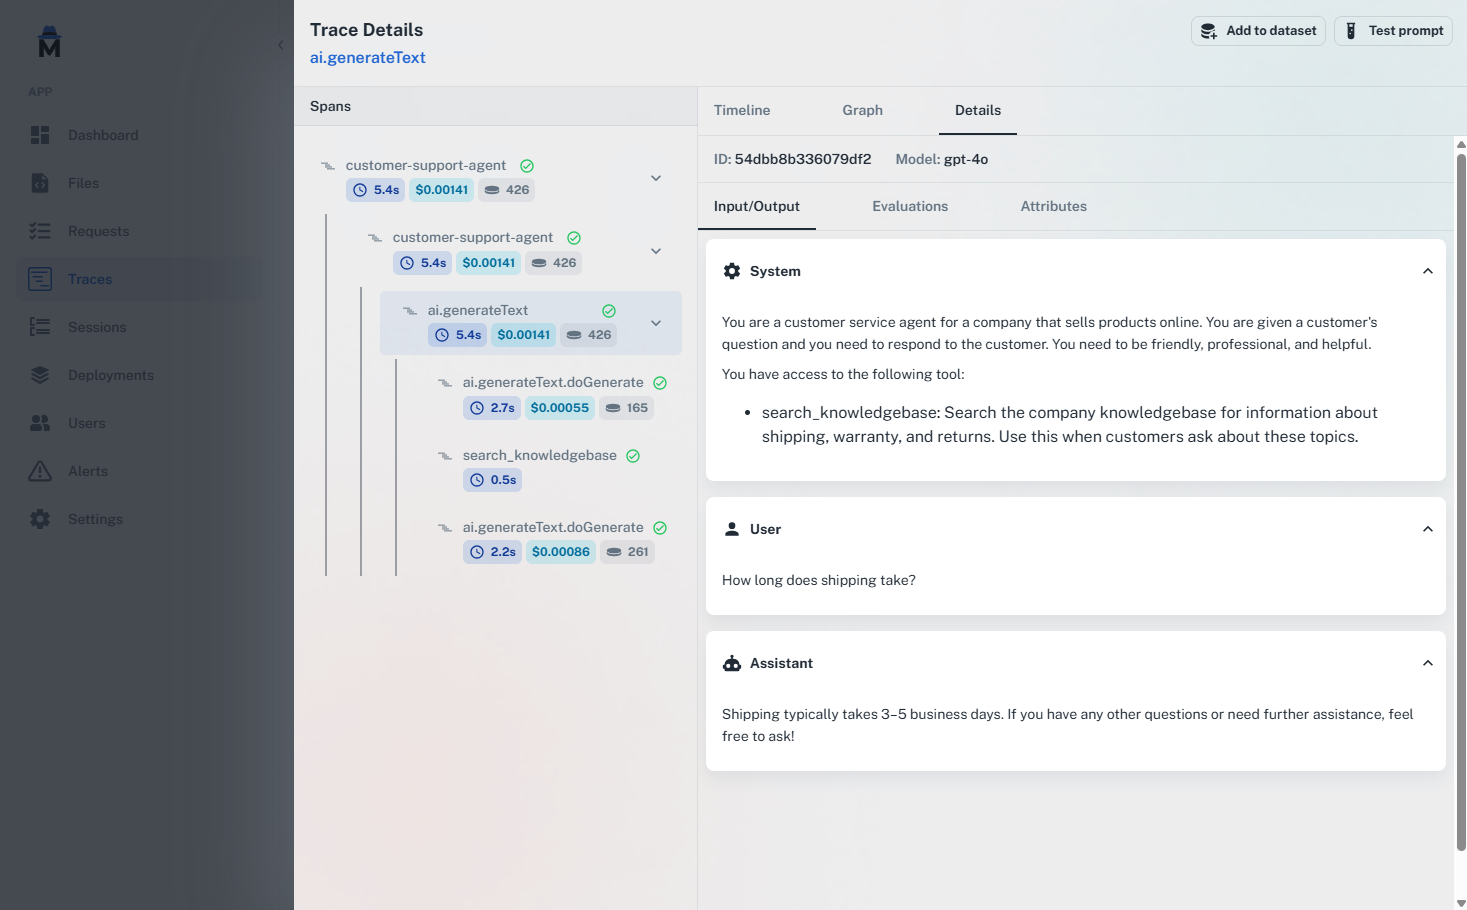
Understanding traces
A trace represents the complete execution of a prompt, including all its steps, tool calls, and metadata. Each trace contains: Execution timeline: see exactly when each step occurred and how long it took. Token usage: track input tokens, output tokens, and total tokens consumed. Costs: monitor spending on a per-request basis. Tool calls: view all tool executions, their parameters, and results. Custom metadata: add context like user IDs, session IDs, and custom attributes. Error information: detailed error messages and stack traces when issues occur.Collected spans
AgentMark classifies every ingested span asGENERATION (a model call, detected from gen_ai.* attributes or AI SDK span names such as ai.generateText and ai.streamText) or SPAN (any other operation, including tool calls and custom wrappers); the spans API accepts a third type, EVENT, for point-in-time records. See Collected spans in the Span reference for the canonical span-type and attribute reference.
Span kinds
Each span carries a semantic kind (function (default), llm, tool, agent, retrieval, embedding, or guardrail) that categorizes the type of operation it represents. Span kinds affect how you filter spans and how dashboards group analytics.
Set span kinds in code by wrapping functions with observe(). See SpanKind values for the full list.
LLM span attributes
Each LLM span contains attributes that vary slightly depending on the SDK integration you use. The table below shows common attributes across integrations:- AI SDK (Vercel)
- Claude Agent SDK
agentmark.metadata.* attributes.
Standard OTel GenAI attributes accepted on ingest
Trace ingestion also accepts the standard OTel GenAI semantic convention attributes as fallbacks when the AgentMark keys are absent, so spec-conformant instrumentation works without modification:
AgentMark-emitted keys (
agentmark.* and the existing gen_ai.request.input / gen_ai.response.output) always take precedence over these fallbacks.
The SDKs’ observe() / @observe wrappers and setInput() / setOutput() helpers write their IO to the canonical vendor-namespaced agentmark.request.input / agentmark.response.output attributes. They also emit the matching gen_ai.request.input / gen_ai.response.output keys for compatibility.
Grouping traces
Organize related traces together using custom grouping. This is useful for understanding complex workflows that span multiple prompt executions.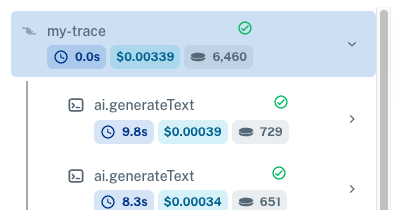
Viewing traces
View traces in your local dev server athttp://localhost:3000 or in the AgentMark Dashboard under the Traces tab. Both render the same trace explorer (execution timeline, span tree, graph view, and per-span attribute drill-down). Each trace shows:
- Complete prompt execution timeline
- Tool calls and their durations
- Token usage and costs
- Custom metadata and attributes
- Error information (if any)
- Graph visualization (when graph metadata is present)
- Manual annotations for quality assessment
Generated media
When a span’s input or output contains generated media (images or audio), the Input / Output tab renders it inline. Images render as an<img>, audio with a player, in place of the raw payload.
Media renders when the field value is, or contains, objects shaped { mimeType, base64 }. The Vercel AI SDK’s mediaType key also works. An image-generation output of [{ "mimeType": "image/png", "base64": "..." }], for example, renders as the image. A value of any other shape renders as text.
AgentMark stores large fields (base64 media included) in object storage at ingest, then fetches them on demand when you open the span, so the trace list and timeline stay fast. This happens automatically, with no configuration.
AgentMark’s prompt runner captures generated images and audio automatically. The AI SDK’s
experimental_generateImage emits no telemetry of its own, so to capture media from your own code, instrument the call and set the media as the span output. See Tracing image generation.Filtering and search
AgentMark provides filtering across all trace dimensions: model, status, latency, cost, tokens, metadata, scores, and more. You can combine filters, save them as views, and share them via URL. Learn more about filtering and searchIntegration
AgentMark works with any application that uses OpenTelemetry. For detailed setup instructions, see Tracing setup.Gateway MCP
For debugging traces directly from your IDE, the gateway MCP server exposes the full AgentMark API as editor tools; for trace work you’ll mostly uselist_traces, get_trace, and list_spans. This lets you query and inspect traces without leaving your development environment.
Traces and spans API
You can query traces and spans programmatically using the REST API or the CLI. Both the local dev server and the AgentMark Cloud gateway expose/v1/traces, /v1/traces/{traceId}, and /v1/spans, so you can develop against local data and switch to Cloud without changing your integration. Bulk export (/v1/traces/export) is Cloud-only.
- Local REST
- REST API (Cloud)
- REST API (local)
Cross-trace span search
TheGET /v1/spans endpoint lets you search spans across all traces in your project. Unlike the traces API, which returns traces and their nested spans, the spans endpoint queries individual spans directly, regardless of which trace they belong to.
This is useful when you need to:
- Find all LLM calls using a specific model across your entire project
- Identify slow operations by filtering on duration thresholds
- Audit error spans across traces without browsing each trace individually
- Analyze usage patterns for a particular span type (for example, all
GENERATIONspans)
- Local REST
- REST API
traceId, so you can drill into the full trace for any span that matches your search.
Advanced filtering
BothGET /v1/traces and GET /v1/spans accept a filter parameter: a string DSL that combines predicates with and and supports parenthesized OR-groups, for example (model = "gpt-5" or model = "o3") and status = ERROR. For structured JSON filters with the additional in, notIn, and between operators, use POST /v1/traces/search and POST /v1/spans/search. GET /v1/filter-schema returns a machine-readable list of the filterable fields and operators per resource. See the API reference for the full grammar and request schemas.
Payload size limits
To guarantee reliable ingestion, AgentMark truncates oversized span payload fields at ingest time:- Per-field limit: 48 KiB. AgentMark cuts any string attribute value (inputs, outputs, tool calls, event attributes such as stack traces) larger than 48 KiB at a UTF-8-safe boundary.
- Per-span limit: 100 KB. If a span’s total serialized size still exceeds 100 KB (several large fields), AgentMark shrinks the largest fields further until the span fits.
truncated_fields entry in their metadata (visible in the span’s Metadata, for example ["ai.prompt.messages"]) listing exactly which fields AgentMark cut. AgentMark stores spans below the limits byte-for-byte as sent.
If you routinely need full multi-hundred-KB payloads, store the full content in your own object storage and put a reference (URL or key) in span metadata instead.
Best practices
- Use meaningful IDs: choose descriptive function IDs for easy filtering and debugging.
- Add context: include relevant metadata like user IDs, session IDs, and business context.
- Monitor regularly: check traces frequently to catch issues early.
- Set up alerts: configure alerts for cost, latency, or error thresholds.
- Analyze patterns: use the Dashboard’s filtering to identify trends and patterns.
Next steps
Sessions
Group related traces together
Alerts
Get notified of critical issues
Annotations
Manually label and score traces
Tracing setup
Integrate observability in your app
Have questions?
Reach out any time:
- Email the team at hello@agentmark.co for support
- Schedule an Enterprise Demo to learn about AgentMark’s business solutions